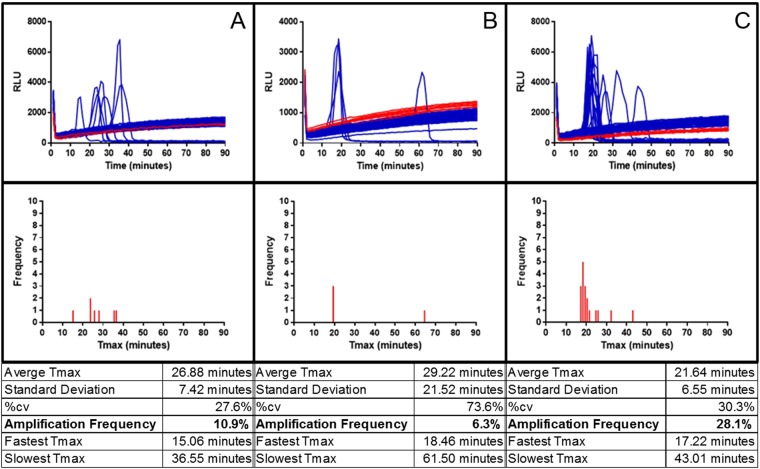
Figure 8.
LAMP-BART detection of 0.8 copies of 35S promoter or NOS terminator sequences in denatured maize genomic 0.1 percent Bt11 DNA extract. Column (A) K+ primer assay; column (B) Z primers; column (C) NOSt primer assay. The top row shows traces from replicate partitions of LAMP-BART assays for 0.8 copies per partition (n = 64) in blue and the NTCs (n = 8) in red. The frequency distribution of LAMP-BART Tmax time-to-peak results for each assay is below with a summary analysis table. HPLC grade primers and fast Bst v2.0 warm start polymerase were used for all three sets.

