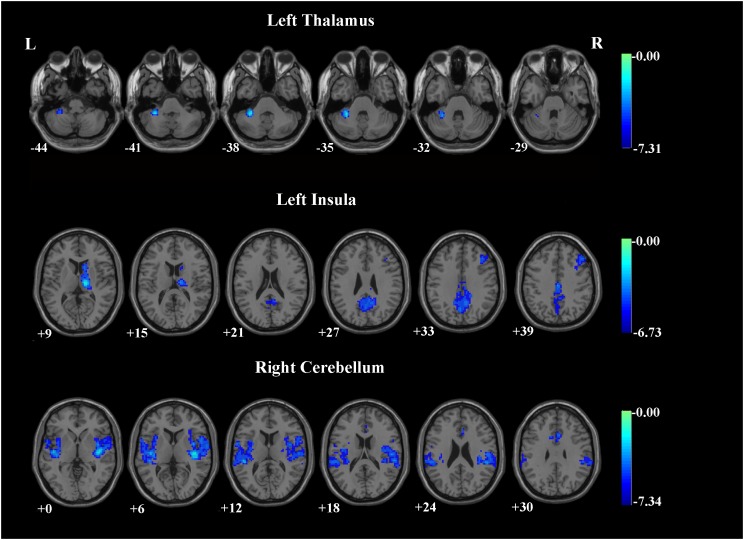
FIGURE 1.
Brain regions demonstrating group differences of the iFC between SN subregions and whole brain voxels in patients with OCD. The threshold was set at a voxel p-value < 0.001 and a cluster p-value < 0.00263, two-tailed (Bonferroni corrected using the GRF method). L, left side; R, right side.

