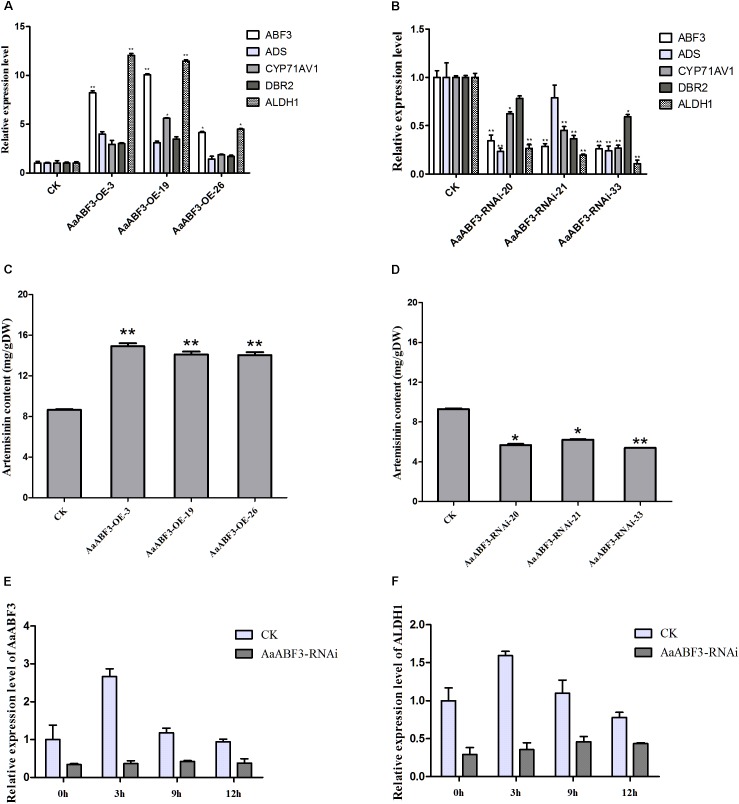
FIGURE 5.
(A,B) Expression analysis of AaABF3, ADS, CYP71AV1, DBR2, and ALDH1 in 3-month-old AaABF3-OE transgenic A. annua plants (A) and AaABF3-RNAi transgenic A. annua plants (B), respectively. (C,D) Contents of artemisinin in leaves of 3-month-old AaABF3-OE transgenic A. annua plants (C) and AaABF3-RNAi transgenic A. annua plants (D), respectively as determined by HPLC. (E,F) Expression analysis of AaABF3 (E) and ALDH1 (F) in AaABF3-RNAi transgenic A. annua plants at 0, 3, 9, and 12 h after ABA treatment. The β-actin was used as control in (A,B,E,F). Student’s t-test with P value determined whether the group difference was significant. ∗P < 0.05; ∗∗P < 0.01. Error bars represented the standard deviation (n = 3).

