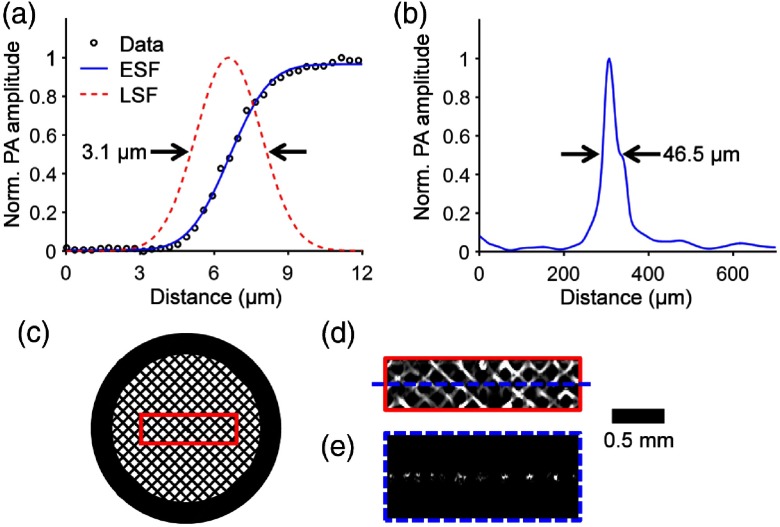
Fig. 3.
Characterization of the fsOR-PAE probe. (a) Lateral resolution test on a sharp edge. ESF, edge spread function; LSF, line spread function derived from ESF. (b) Axial resolution test on a tungsten wire. (c) Photograph of a metal grid. (d) Maximum amplitude projection image computed from the region enclosed by the red rectangle in (c). (e) B-scan image in the plane highlighted by the blue dashed line in (d).

