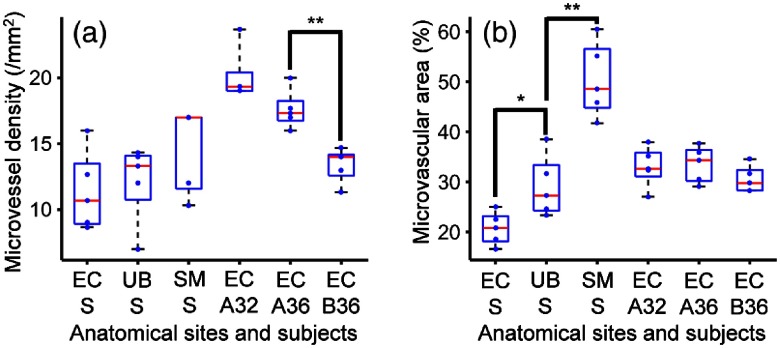
Fig. 7.
Box plots for the histomorphological quantities calculated from the fsOR-PAE images. Five images were analyzed for each subject. (a) Microvessel density and (b) total microvascular area. EC A32, the ectocervix of the first patient at 32 weeks of gestation; EC A36, the ectocervix of the first patient at 36 weeks of gestation; EC B36, the ectocervix of the second patient at 36 weeks of gestation; EC S, the ectocervix specimen; SM S, the sublingual mucosa specimen; UB S, the uterine body specimen. *, **.

