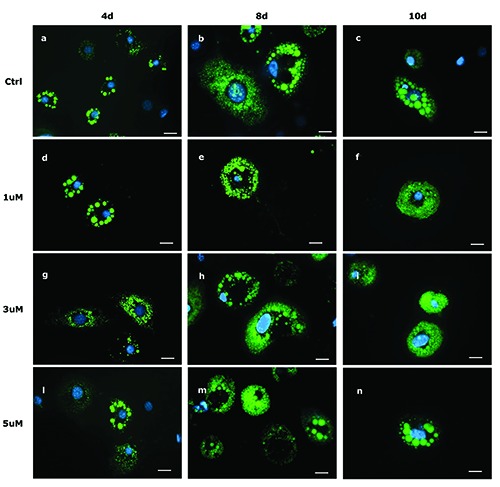
Figure 1.

Lipid droplet pattern (stained with BODIPY 493/503) in fixed 3T3-L1 cells at 4d (a,d,g,l), 8d (b,e,h,m), and 10d (c,f,i,n). Control cells (a,b,c) and cells treated with 1 mM (d,e,f ), 3 mM (g,h,i) and 5 mM (l,m,n) of BAIBA are shown. Nuclear staining DAPI. Images are representative of n. 5 biological replicates. Scale bars: 20 mm.
