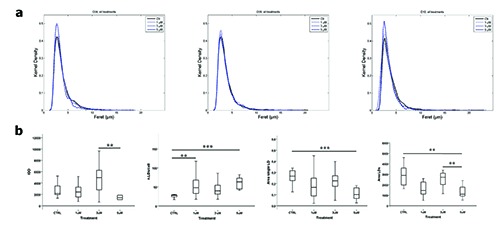
Figure 2.

a) Kernel distribution of the Feret of the lipid droplets at 4, 8 and 10 days of differentiation in control and BAIBA-treated cells. b) Lipid droplet measurements on 3T3-L1 in presence of different BAIBA doses: Integrated optical density (IOD), number of LDs per cell, area of single LD after 4 days of differentiation and total area of LD and after 10 days of differentiation. Box plots show median (horizontal lines), first-to-third quartile (box), and the extreme values with the interquartile range (vertical lines). The area measures are expressed in mm2 and are the average of 10 fields of each concentration. ***P<0.001, **P<0.05.
