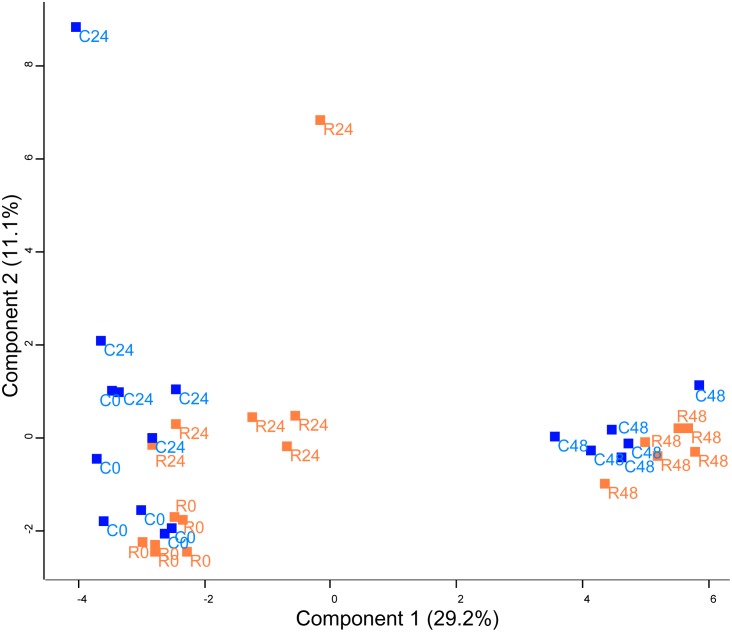
FIGURE 2.
Principal component analysis (PCA) of protein abundance in Chlamydomonas cells treated with rapamycin or drug vehicle during a time course experiment (0, 24, and 48 h). The PCA includes all quantified proteins. Dots are the biological replicates (n = 5–6), control samples are colored in blue and rapamycin samples are colored in orange.

