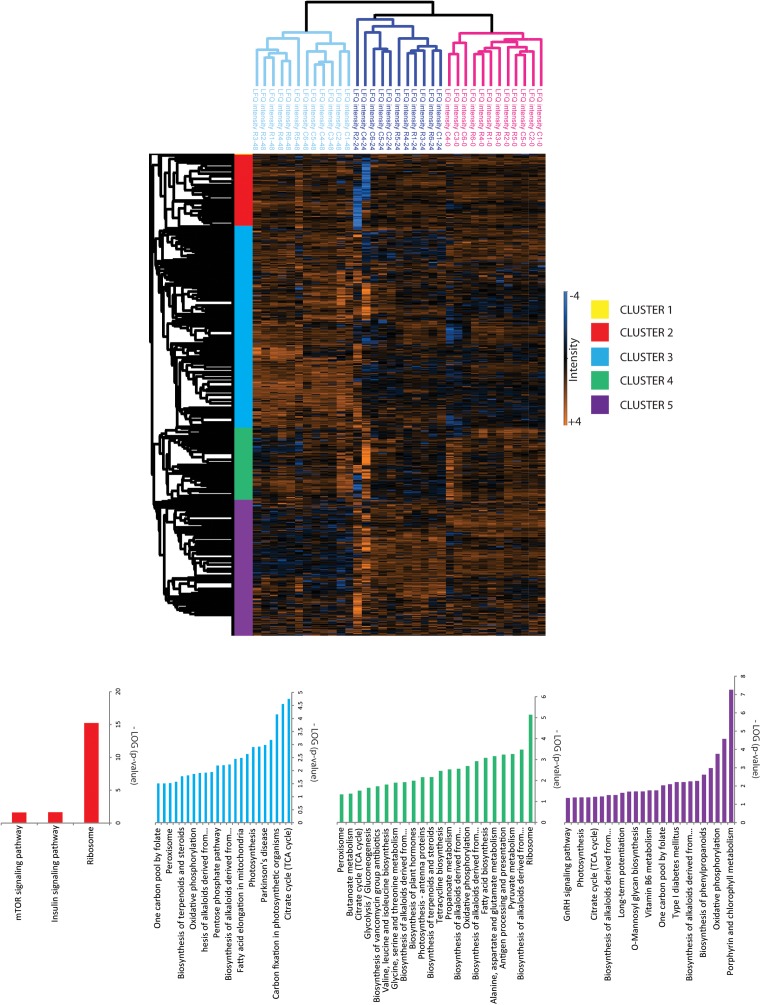
FIGURE 3.
Hierarchical cluster analysis of quantified proteins. Clustering of proteins and samples was done based on Euclidian correlation and average linkage with Perseus. Clusters were exported in Supplementary Table S1 and KEGG enrichment analysis was done with the Algal functional annotation tool (Lopez et al., 2011) for each cluster as referred in Supplementary Table S1.

