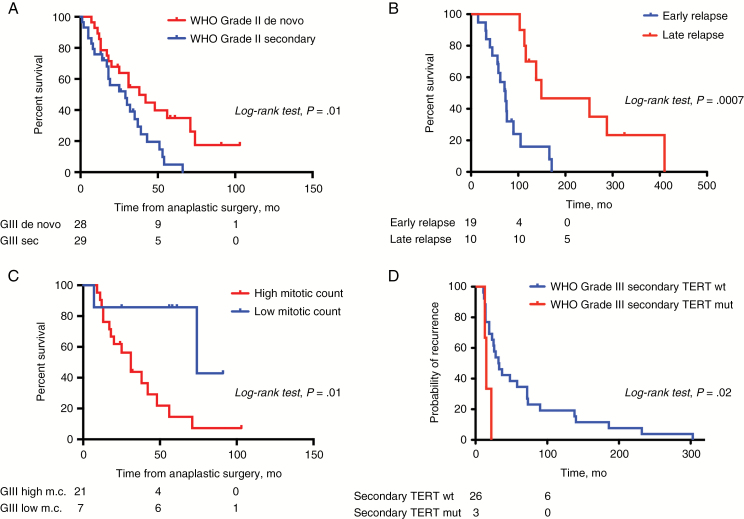
Fig. 3.
Survival analysis of anaplastic meningiomas. (A) Overall survival of de novo vs secondary anaplastic meningiomas. (B) Overall survival of secondary anaplastic meningiomas depending on time to first relapse from a low-grade meningioma. (C) Overall survival of de novo anaplastic meningiomas depending on mitotic count. High mitotic count: meningiomas presenting with >20 mitoses per 10 HPF with or without associated anaplasia. Low mitotic count: meningiomas presenting with <20 mitoses per 10 HPF but with frank anaplasia. (D) Progression-free survival of secondary anaplastic meningiomas depending on TERT promoter mutation status. sec = secondary; m.c. = mitotic count. mut = mutant; wt = wild-type. Numbers of subjects at risk are indicated below plots at time points 0, 50, and 100 months.

