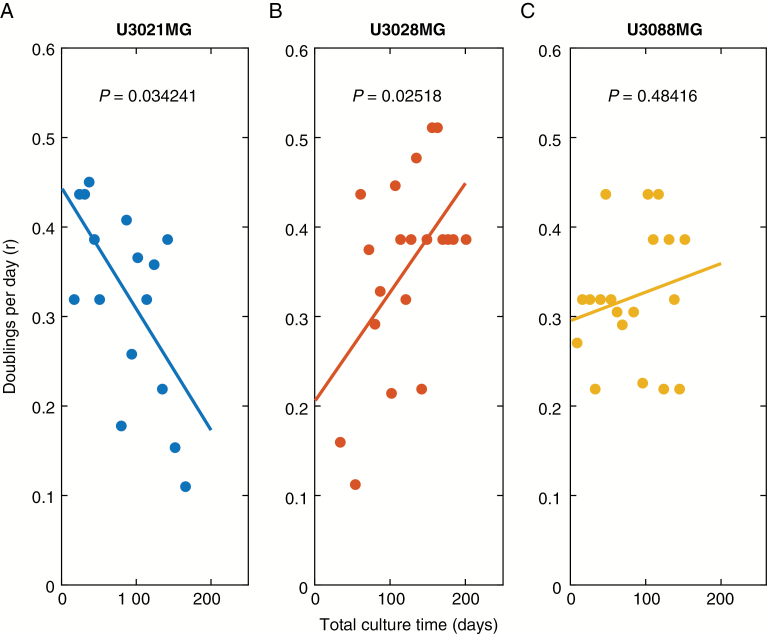
Fig. 3.
Estimation of growth rates during long-term cell culturing. The r values for each cell culture passage for the cultures (A) U3021MG, (B) U3028MG, and (C) U3088MG lines are fitted with robust linear regression and the P-value refer to the rejection of null model that the slope is zero (no change in r over time).

