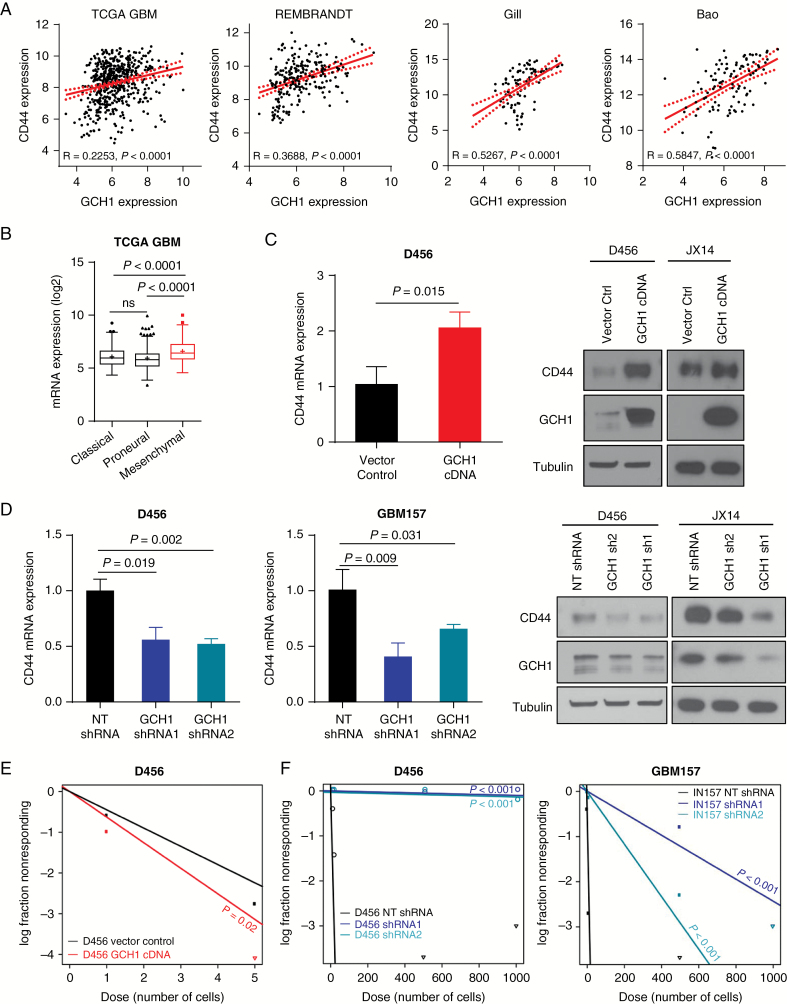
Fig. 3 .
Modulation of GCH1 level affects BTIC maintenance in human GBM cells. (A) In silico analyses showing correlations between GCH1 and the BTIC marker CD44 in human glioma gene expression datasets. Spearman rho value (R) for each correlation is shown. (B) In silico analysis showing GCH1 expression in 3 GBM molecular subtypes in the GBM datasets from TCGA. Note that the mesenchymal subtype (red) is marked for its increased CD44 expression. P-value shown with t-test comparison. (C) Analyses by qRT-PCR and western blot of CD44 expression in D456 cells with GCH1 overexpression in comparison to the vector control. P-value shown with t-test comparison. (D) Analyses by qRT-PCR and western blot of CD44 expression in human GBM xenolines with GCH1 knockdown. P-value shown with t-test comparison between pair of indicated samples. (E) Comparison of BTIC frequencies in D456 with GCH1 overexpression measured using in vitro limiting dilution sphere formation assay. P-value shown with extreme limiting dilution analysis (ELDA). (F) Comparisons of BTIC frequencies in D456 and GBM157 with GCH1 knockdown measured using in vitro limiting dilution sphere formation assay. P-value shown with ELDA analysis. For all bar graphs, error bars represent standard deviations.

