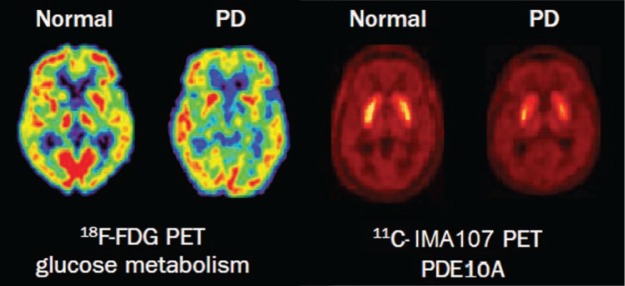
Fig 2.
Molecular imaging of glucose metabolism and PDE10A expression in Parkinson’s disease. PET imaging shows decreased glucose metabolism and PDE10A expression in a patient with PD compared with a healthy control. PD = Parkinson’s disease; PDE10A = phosphodiesterase 10 A; PET = positron emission tomography. Reproduced with permission from Politis M (2014).1

