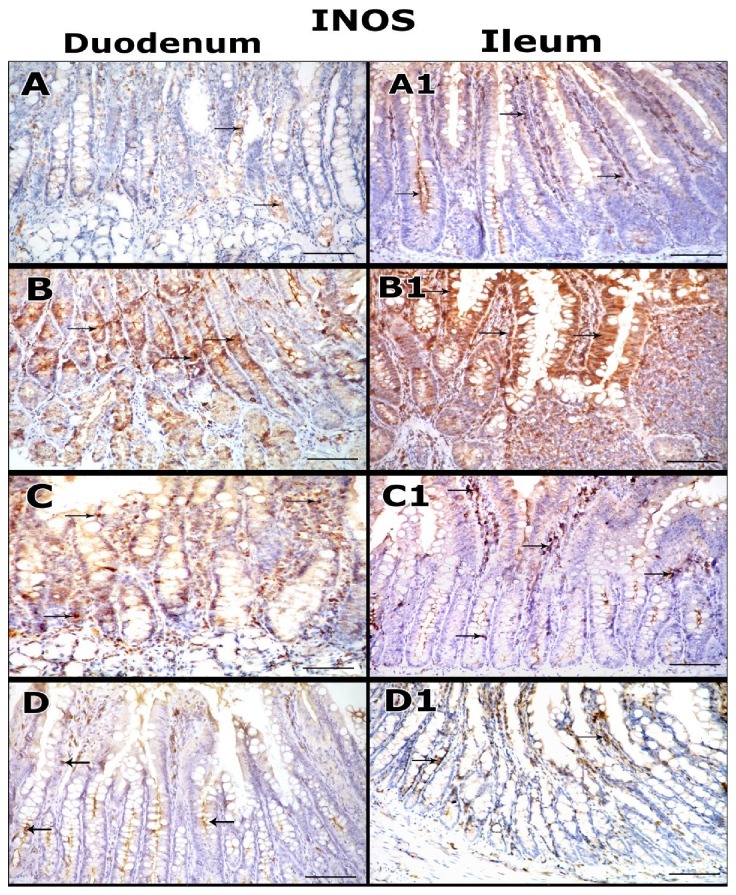
Figure 4.
Immunohistochemical staining micrographs of intestinal tissues (duodenum and ileum) of the studied groups for iNOS expressing cells (arrow). A, A1: Control group section shows few weak iNOS-positive cells. B, B1: Iron overload group section shows numerous strongly positive cells. C, C1: Iron + DFO group section shows reduction of iNOS expressing cells. D, D1: Iron+ Quercetin group shows marked reduction of the expressing cells in most areas (immunoperoxidase, haematoxylin counter-stain, x200).

