
Figure 5.
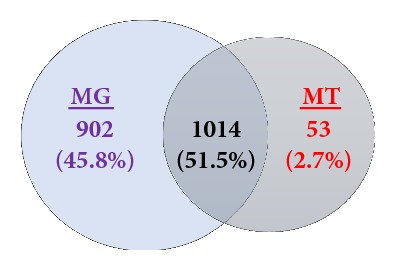
Comparison of the metabolic function of metagenome (MG) and metatranscriptome (MT). Venn diagram for unique and shared metabolic functions identified by KEGG at functional level 4 in the MG (MG-HS100-MS151-MS301) and MT (MT-HS100-MS151-MS301).