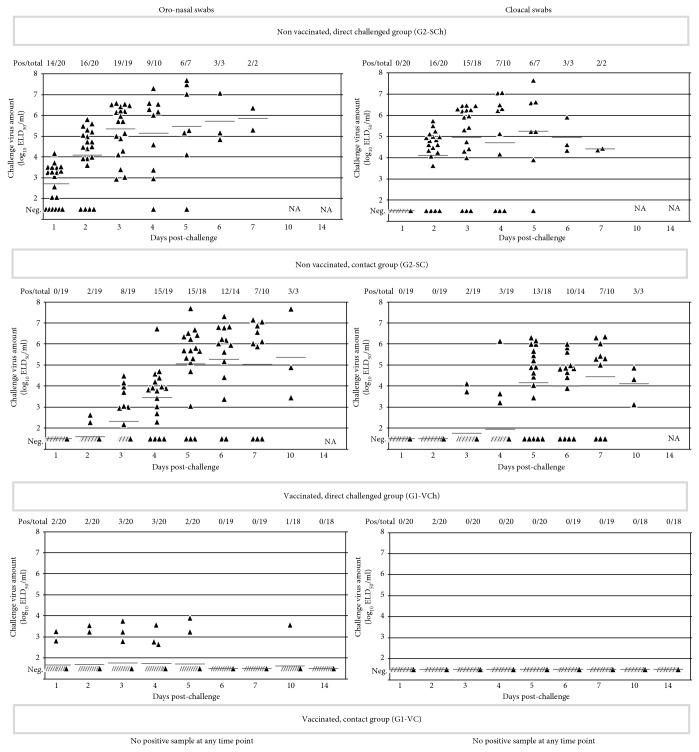
Figure 4.
Oronasal and cloacal shedding by broilers. AIV load of swab samples measured by qRRT-PCR is presented as log10ELD50/ml in the scatterplot; horizontal bars represent group mean value for each date. For calculation of mean, negative samples were given a value of 1.5 log10 ELD50/ml. Contact challenged groups (G1-VC and G2-SC) were comingled with the direct-challenged control group (G1-VCh and G2-SCh) from 8 hours postchallenge. Sampling date refers to the time after direct challenge.

