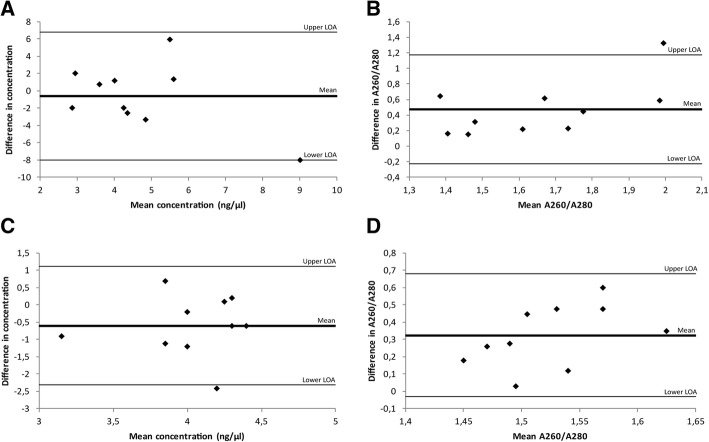
Fig. 2.
Bland-Altman plots for investigation of level of agreements between DNA extraction kits. Each plot shows the differences between the two kits against the averages of the two kits. The lines represent the mean differences and upper and lower limits of agreement (LOA, mean differences ±1.96SD). a Comparison of DNA yield (ng/μl) of samples extracted with High Pure FFPET DNA Isolation kit and QIAamp® DNA FFPE Tissue kit. b Comparison of purity (A260/A280) of DNA samples extracted with High Pure FFPET DNA Isolation kit and QIAamp® DNA FFPE Tissue kit. c Comparison of DNA yield (ng/μl) of samples extracted with QIAamp® DNA FFPE Tissue kit and AllPrep® DNA/RNA FFPE kit. d Comparison of purity (A260/A280) of samples extracted with QIAamp® DNA FFPE Tissue kit and AllPrep® DNA/RNA FFPE kit

