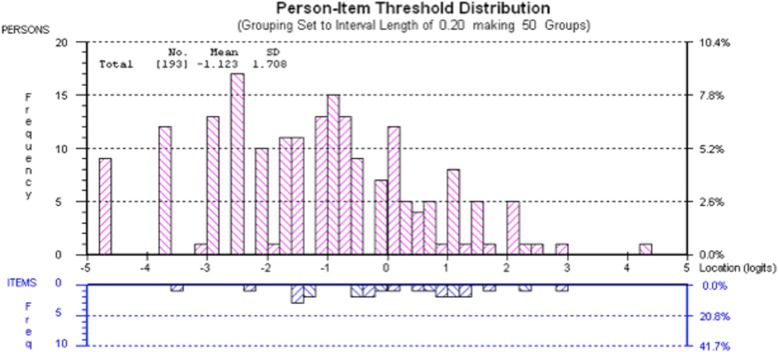
Fig. 2.
Targeting of CARIES-QC. The upper section of the graph shows the distribution of participants and the lower part the distributions of thresholds (category transitions) of the items. The x-axes display the location (severity of impact) of the participants and the item location (difficulty) of the item thresholds. The y-axes show the frequency of item thresholds and participants

