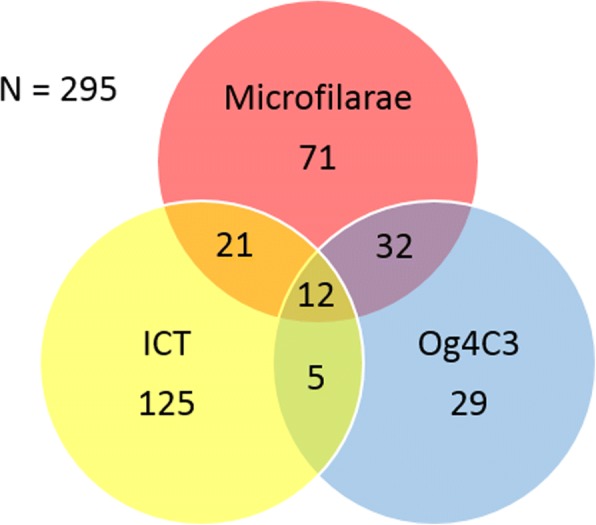
Fig. 1.

Distribution of diagnostic tests utilised by the surveys included. Values represent the number of surveys that utilised a specific diagnostic or combination of diagnostics

Distribution of diagnostic tests utilised by the surveys included. Values represent the number of surveys that utilised a specific diagnostic or combination of diagnostics