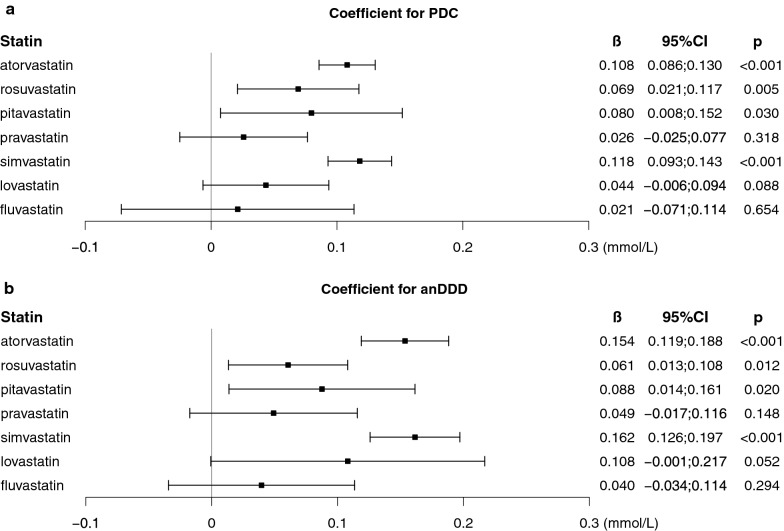
Fig. 3.
Effects of individual statins on the change in fasting glucose. Data are coefficients (β) and 95% CIs of individual statins on the change in fasting glucose derived by the multivariate linear-mixed models adjusted for the variables listed in Table 3. PDC, proportion of days covered by statins for the period between baseline and serial measurements of fasting glucose; anDDD, average number of defined daily doses per day; CI confidence interval

