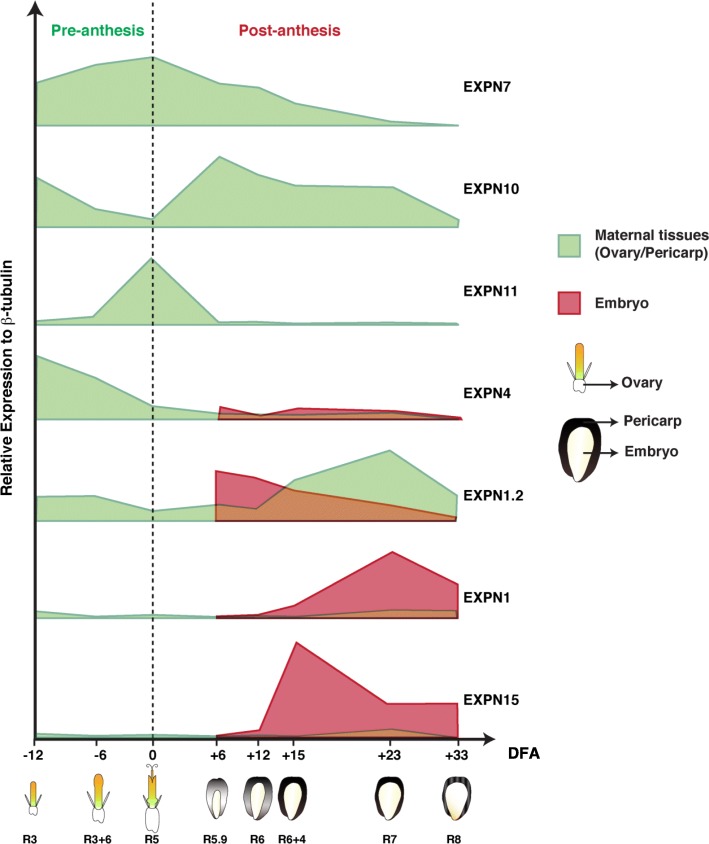
Fig. 5.
Schematic model representing expression patterns of seven EXPN genes during sunflower ovary and grain growth. Relative expression of EXPN genes is based on qRT-PCR analysis from samples harvested at various days from anthesis. The development stage according to Schneiter and Miller (1981) scale is indicated below each ovary and grain. The dashed line divides pre- and post-anthesis periods (DFA = Days from anthesis)

