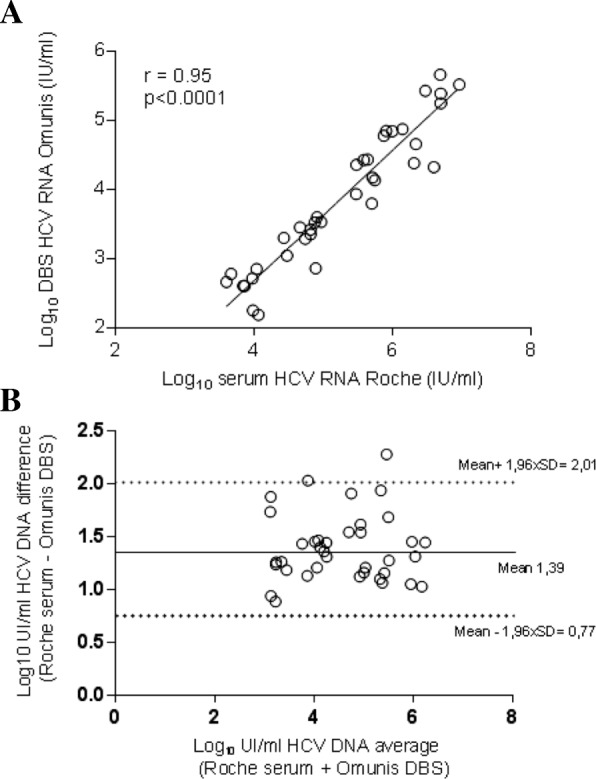
Fig. 1.

Regression analysis of HCV RNA levels and Bland-Altman plot of titer differences in paired DBS and serum samples collected in Montpellier University Hospital, France. a Linear regression analysis HCV RNA levels for 37 matched DBS–serum pairs. b Agreement between the HCV RNA quantification by plotting the differences between serum and DBS specimen averages of the two techniques using the Bland-Altman analysis
