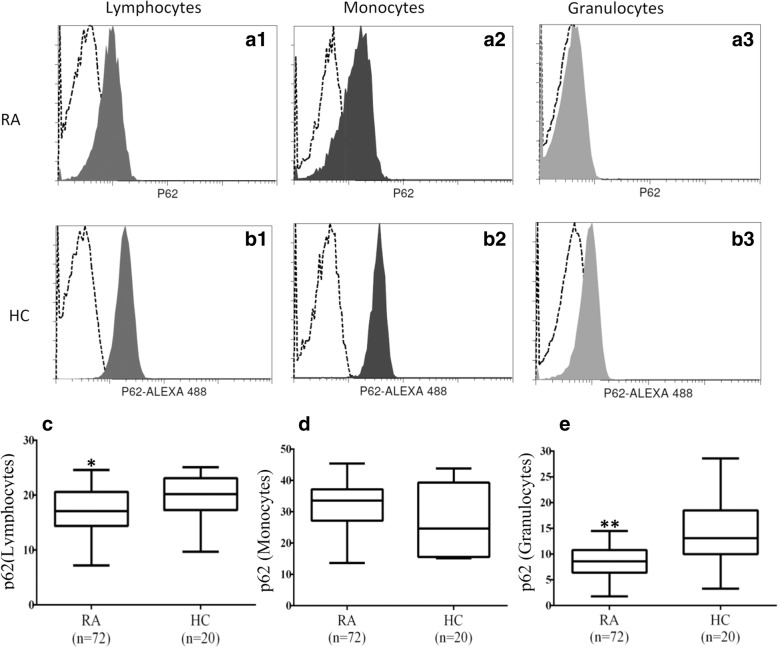
Fig. 2.
Representative cytometric histograms of p62 levels in lymphocytes (a1 and b1), monocytes (a2 and b2), and granulocytes (a3 and b3) from one patient with rheumatoid arthritis (RA) and one healthy control subject (HC). Gray shadows indicate cytometric histograms of the stained p62 expression in immune cells from patients with RA and HC. Comparisons of p62 mean fluorescence intensity in lymphocytes (c), monocytes (d), and granulocytes (e) between patients with RA and HC. Data are presented as box plot diagrams, with the box encompassing the 25th percentile (lower bar) to the 75th percentile (upper bar). The horizontal line within the box indicates the median value for each group. *p < 0.05, **p < 0.001 vs. HC

