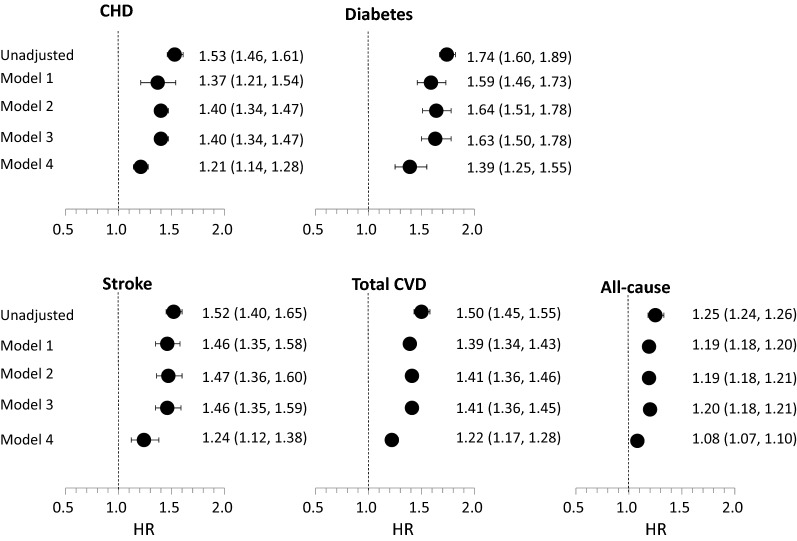
Fig. 3.
Cox hazard ratios for the relationship between a 1 unit lower GIT z-score on an interval scale and cause-specific mortality (all cardiovascular disease, CHD, stroke, diabetes, and all-cause mortality) in sequentially-adjusted models: age, birth year and sex (Model 1); these and BMI (Model 2); these and residential SES (Model 3); these and education and country of origin (Model 4)

