Fig. 1.
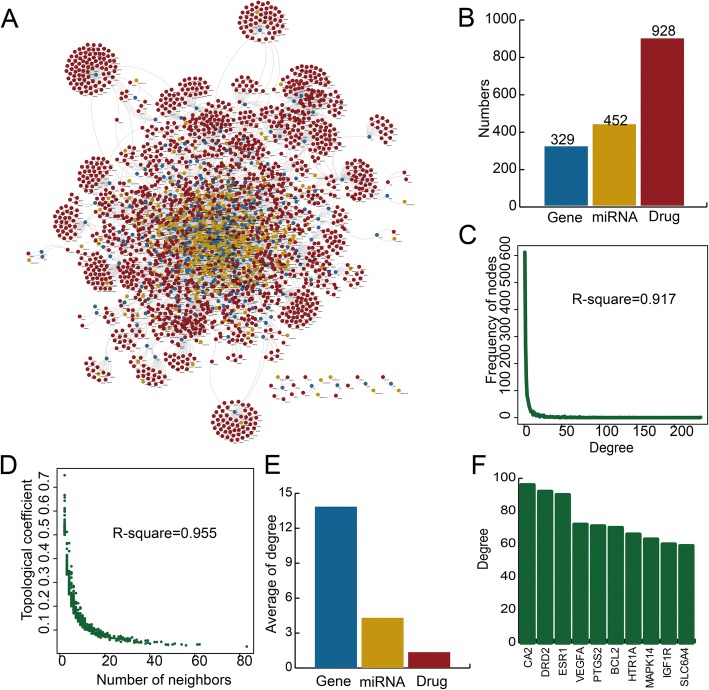
Construction and global characteristics of the MGDT networks for cardiac hypertrophy and AMI. a A global MGDT network for cardiac hypertrophy and AMI. Blue, yellow, and red represent coding genes, miRNAs, and drugs, respectively. b A bar plot showing the numbers of coding genes, miRNAs, and drugs. c Degree distribution of all nodes in the MGDT network. d Topological coefficient of all nodes in the MGDT network. e A bar plot showing the average degrees of coding genes, miRNAs, and drugs. f The degrees of nodes with the highest degrees in the whole network

