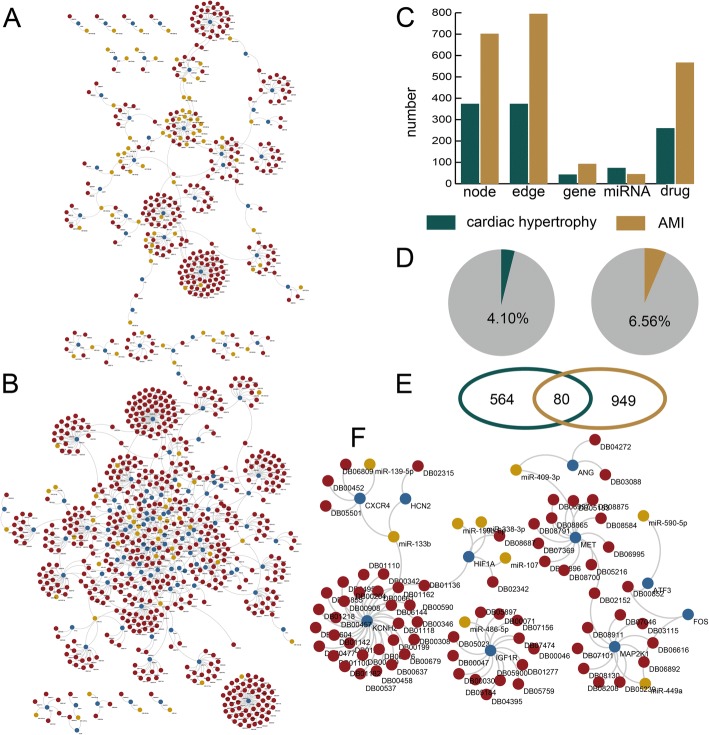
Fig. 2.
The significantly dysregulated MGDTs in the cardiac hypertrophy and AMI networks. a The significantly dysregulated MGDTs in the cardiac hypertrophy network. b The significantly dysregulated MGDTs in the AMI network. c The numbers of nodes, edges, genes, miRNAs, and drugs in the cardiac hypertrophy and AMI networks. d Pie charts showing the percentages of significantly dysregulated MGDTs out of all MGDTs in the cardiac hypertrophy and AMI networks. e Venn diagram showing the common dysregulated MGDTs between the cardiac hypertrophy and AMI networks. f The common dysregulated MGDTs in the networks

