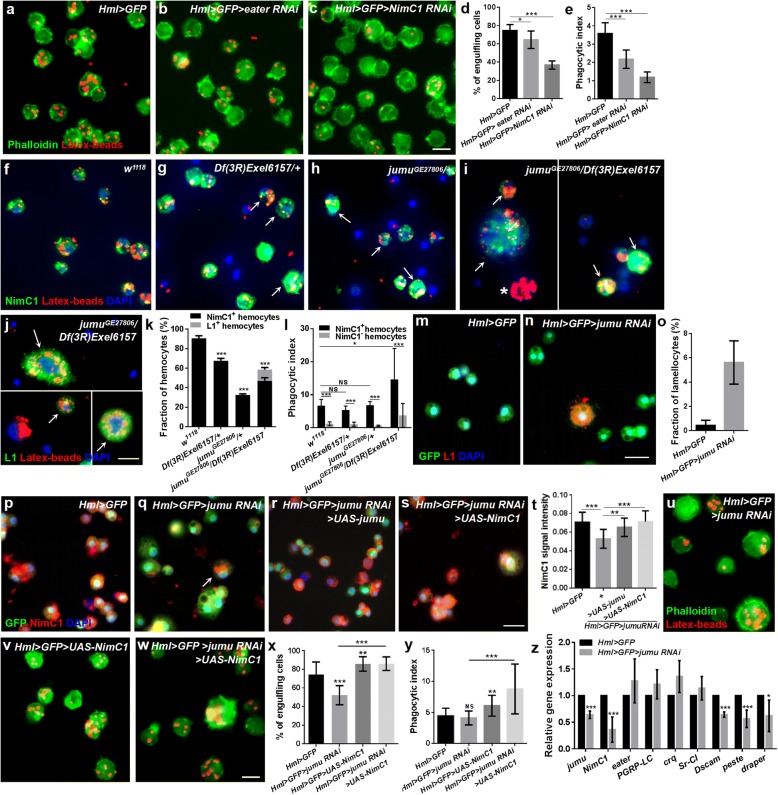
Fig. 2.
Jumu regulates hemocyte phagocytosis via affecting the expression of NimC1. a-c Hemocytes were isolated from third-instar larvae injected with latex beads (red) 1 h postinjection. The actin cytoskeleton was visualized using Alexa Fluor 488-labeled phalloidin (green). d, e Quantification of the percentage of engulfing cells and phagocytic indexes in phagocytosis assays. f-i Immunostaining against NimC1 (green) shows that most circulating hemocytes with strong phagocytosis ability are NimC1-positive in jumu heterozygotes (arrows) (g and h). However, in addition to NimC1-positive circulating hemocytes (arrows), nearly 10% of the NimC1-negative circulating hemocytes (asterisks) also display strong phagocytosis ability in jumu double heterozygotes (i). j Immunostaining against L1 (green) shows that lamellocytes also exhibit strong phagocytosis ability in jumu double heterozygotes (arrows). k Quantification of the percentage of NimC1-positive and L1-positive circulating hemocytes. l Quantification of phagocytosis indexes. m-o Immunostaining against L1 (red) shows that nearly 6% of the lamellocytes are observable in Hml > GFP > jumu RNAi circulating hemocytes. p-s Immunostaining against NimC1 (red) shows that NimC1 expression is reduced in Hml > GFP > jumu RNAi circulating hemocytes compared with that in the controls, and the overexpression of jumu and NimC1 increases the NimC1 level in Hml > GFP > jumu RNAi. t Quantification of the NimC1 signal intensity in circulating hemocytes. u-w Hemocytes were isolated from third-instar larvae injected with latex beads (red) 1 h postinjection. The actin cytoskeleton was visualized using Alexa Fluor 488-labeled phalloidin (green). x, y Quantification of the percentage of engulfing cells and phagocytic indexes in phagocytosis assays. z Real-time PCR analysis of phagocytosis receptor genes levels of circulating hemocytes. Error bars represent the S.E.M of at least 3 independent experiments; not significant; *P < 0.05; **P < 0.01; ***P < 0.001 (Student’s t-test in d, e, k, o, z; one-way ANOVA in l, t, x, y). Scale bars: 10 μm (a-j, u-w); 20 μm (m-s)

