. 2018 Nov 29;8(6):529–533. doi: 10.4103/jispcd.JISPCD_68_18
Copyright: © 2018 Journal of International Society of Preventive and Community Dentistry
This is an open access journal, and articles are distributed under the terms of the Creative Commons Attribution-NonCommercial-ShareAlike 4.0 License, which allows others to remix, tweak, and build upon the work non-commercially, as long as appropriate credit is given and the new creations are licensed under the identical terms.
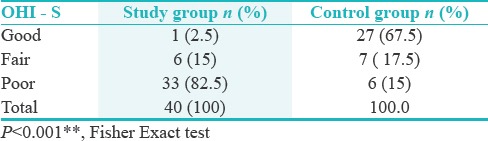
Table 3.
Distribution of study group and control group according to OHI-S