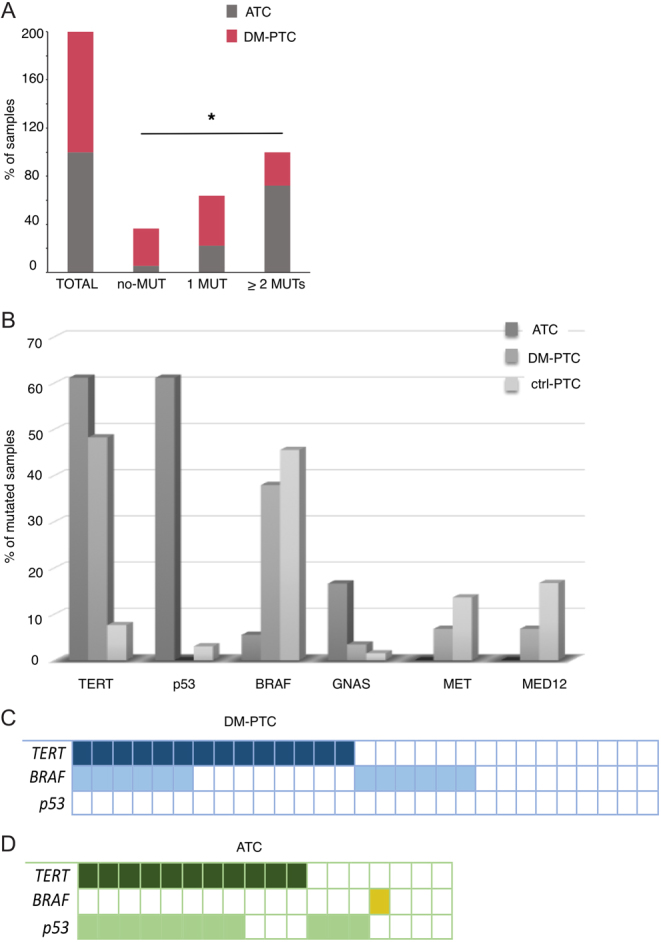
Figure 3.

Differential distribution of HA-TC and ctrl-PTC samples according to the number of mutations (A). Frequency of mutated samples for each gene in HA-TC, DM-PTC and ctrl-PTC samples (B). Representation of concomitant mutations in the three most frequently altered genes (TERT, BRAF and TP53) in DM-PTC (C) and ATC (D).

 This work is licensed under a