Figure 4.

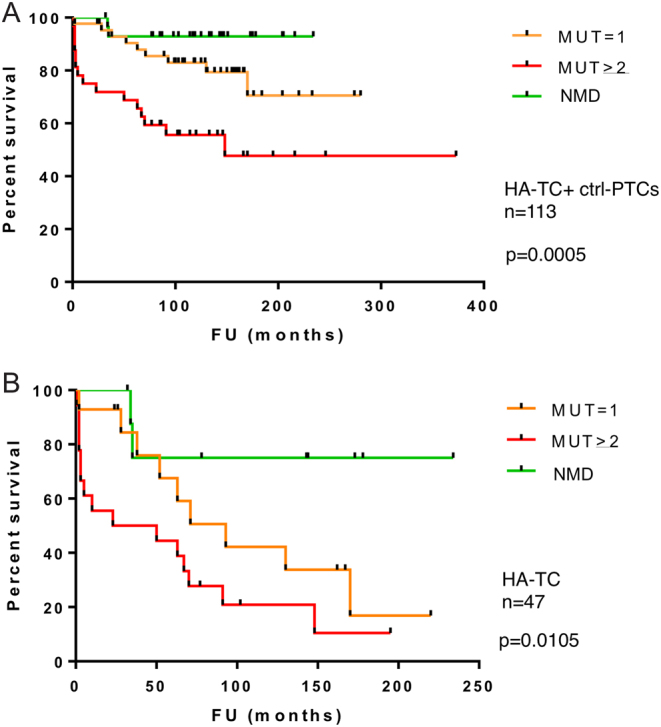
Kaplan–Meier plots for association number of mutations with patient survival in the overall cohort of 113 thyroid cancer analyzed (A) and restricted to the HA-TC subset (B). MUT, mutations; NMD, no detected mutations.

Kaplan–Meier plots for association number of mutations with patient survival in the overall cohort of 113 thyroid cancer analyzed (A) and restricted to the HA-TC subset (B). MUT, mutations; NMD, no detected mutations.