-
A
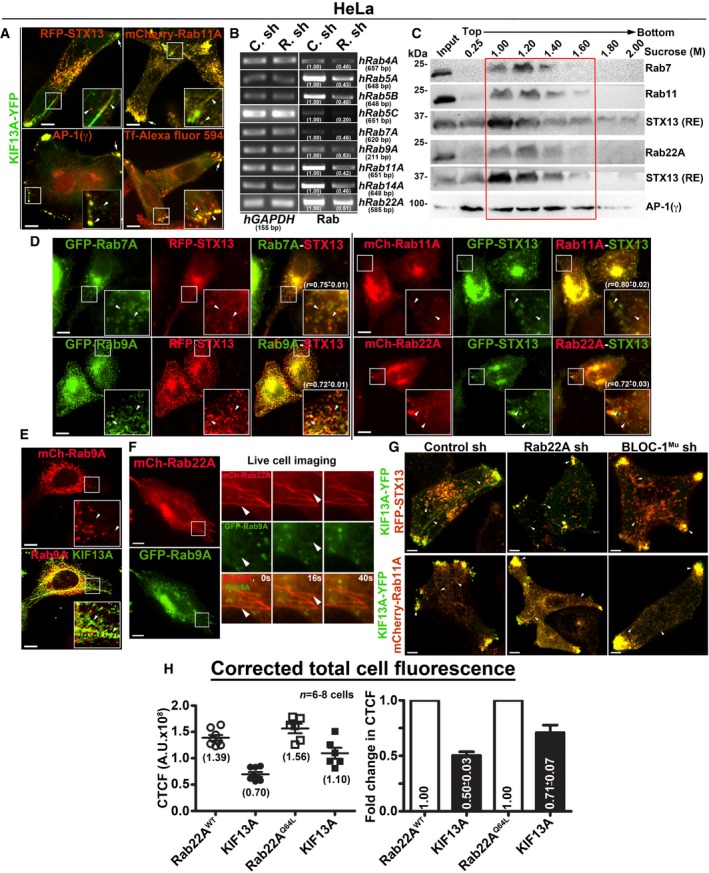
IFM images of HeLa cells to study the localization of KIF13A‐YFP to REs.
-
B
PCR analysis of Rab‐knockdown HeLa cells to measure the knockdown efficiency of each shRNA as indicated. DNA band intensities were quantified and indicated on the gels.
-
C
Subcellular fractionation of HeLa cells to study the localization of different Rabs (red box) with respect to STX13 or AP‐1.
-
D, E
IFM analysis of HeLa cells that were transfected with different constructs as indicated.
-
F
Live cell imaging of mCherry‐Rab22A with respect to GFP‐Rab9A in HeLa cells. Arrowheads point to the Rab22A‐positive tubular structures. Magnified view of insets (at 0, 16, 40 s) are shown separately. Scale bars: 10 μm.
-
G
IFM images of Rab22A sh, BLOC‐1 sh and control sh HeLa cells that were transfected with indicated constructs.
-
H
Graphs represent the measurement of corrected total cell fluorescence (CTCF) in HeLa cells of Fig
2A.
n =
6–8 cells. Average CTCF values (AU: arbitrary units) and their respective fold changes (mean ± SEM) are indicated.
Data information: In (A), arrowheads and arrows point to the KIF13A‐positive tubular REs and E/SEs, respectively. In (D, E, G), arrowheads point to the STX13‐ or KIF13A‐positive tubular REs or E/SEs. Scale bars: 10 μm.

