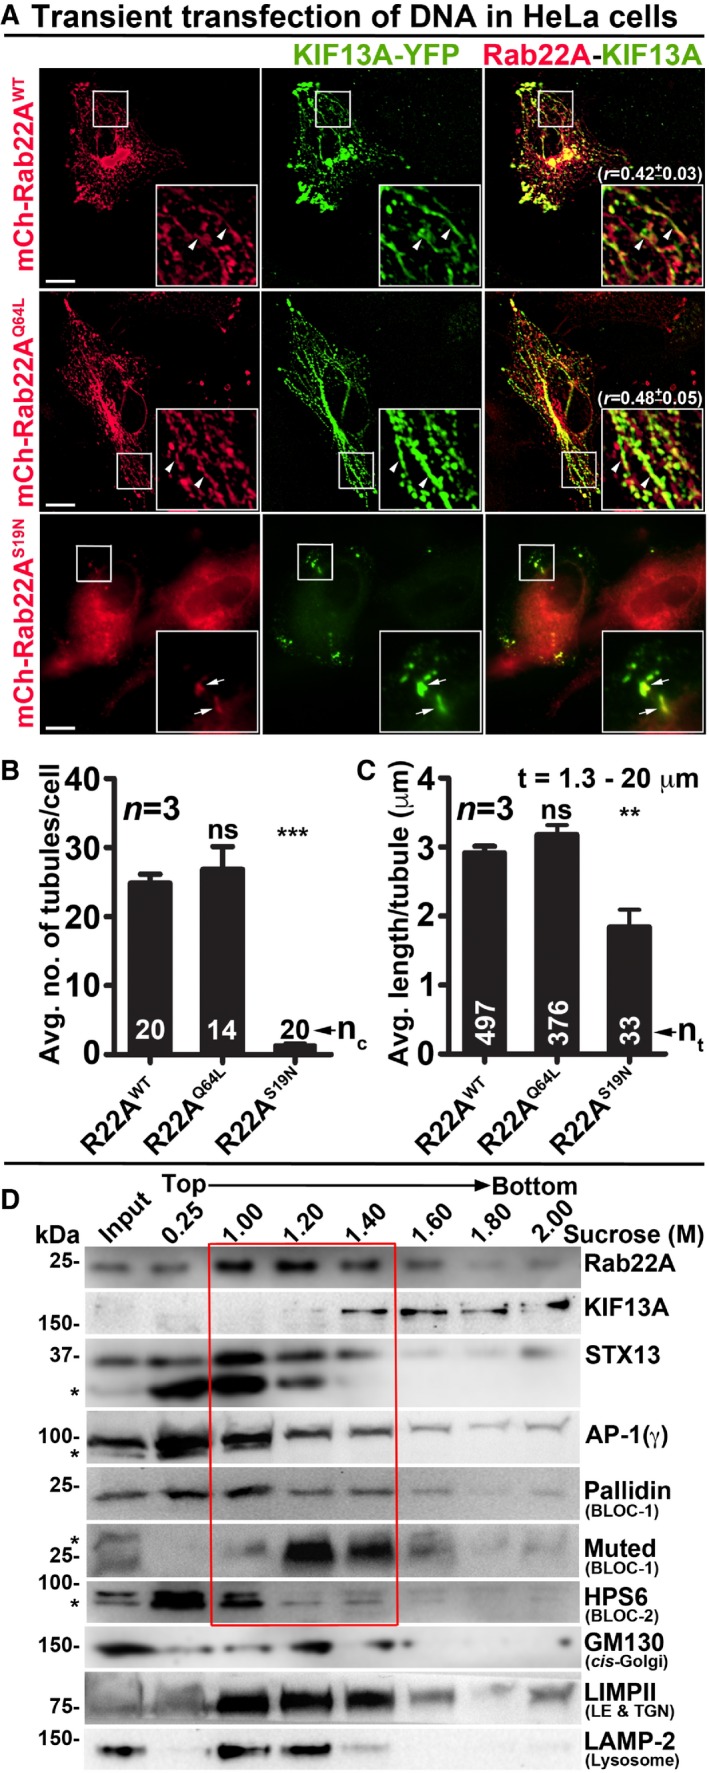
Figure 2. Rab22A localizes to the E/SE and REs and regulates RE dynamics.

-
AIFM images of KIF13A‐YFP and mCherry‐Rab22AWT/Q64L/S19N cotransfected HeLa cells. Arrowheads and arrows point to the KIF13A‐positive tubular REs and E/SEs, respectively. The colocalization coefficient (r, in mean ± SEM) between two markers was indicated separately. Scale bars: 10 μm.
-
B, CGraphs represent the measurement of KIF13A‐positive TN (B) and TL (C) in HeLa cells of Fig 2A (mean ± SEM). n = 3. nc: total number of cells. nt: total number of tubules. **P ≤ 0.01, ***P ≤ 0.001 and ns = not significant (unpaired Student's t‐test).
-
DSubcellular fractionation of HeLa cells to probe the localization of Rab22A (red box) with respect to other organelle‐specific proteins. *, non‐specific bands.
