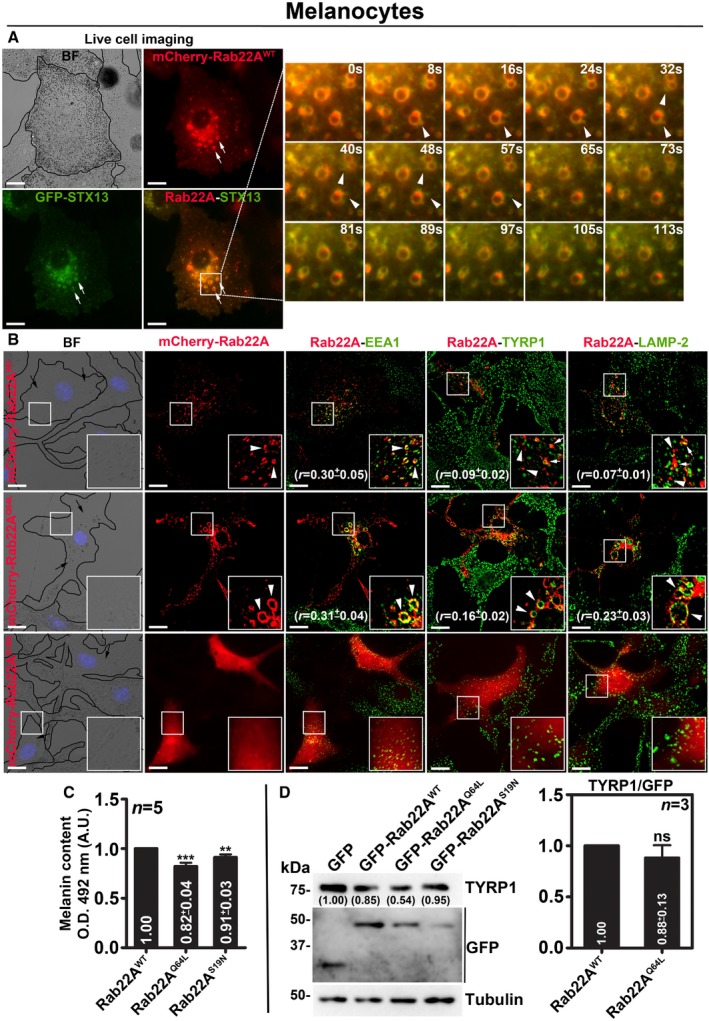
Figure EV2. Analysis of mouse melanocytes expressing different constructs of Rab22A.

-
ALive cell imaging of mCherry‐Rab22A with respect to GFP‐STX13 in wild‐type melanocytes. Arrows point to Rab22A‐positive buds or tubular structures arising from STX13‐positive E/SEs (arrowheads). Magnified view of insets (at various seconds) is shown separately. Scale bars: 10 μm.
-
BIFM analysis of mCherry‐Rab22AWT/Q64L/S19N‐transfected melanocytes. Arrowheads point to Rab22A localization, and arrows indicate the melanocyte pigmentation. Nuclei are stained with Hoechst 33258. The colocalization coefficient (r, in mean ± SEM) between two markers was indicated separately. Scale bars: 10 μm.
-
C, DQuantification of melanin content (C, n = 5) and the protein levels of TYRP1 (judged by immunoblotting in D, n = 3) in melanocytes that were transfected with GFP‐Rab22AWT/Q64L/S19N. In (D), graph indicates the relative levels (mean ± SEM) of TYRP1 with respect to overexpressed Rab22A. Protein band intensities were quantified and indicated on the gels. **P ≤ 0.01, ***P ≤ 0.001 and ns = not significant (unpaired Student's t‐test).
