
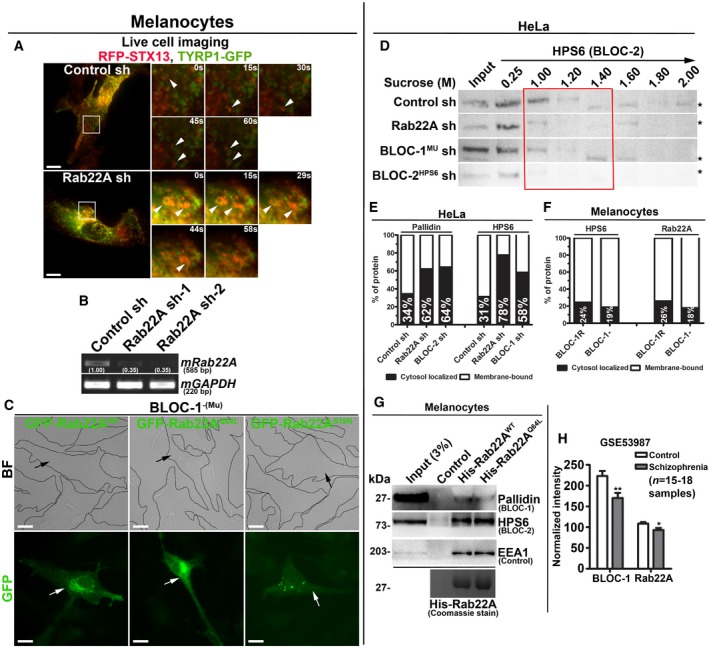
Figure EV4. Analysis of Rab22A‐knockdown and BLOC‐1‐deficient melanocytes expressing different constructs and membrane association and interaction studies of Rab22A. Rab22A as possible susceptible gene for schizophrenia.
-
ALive cell imaging of TYRP1‐GFP with respect to RFP‐STX13 in control and Rab22A‐depleted melanocytes. Arrowheads point to TYRP1‐positive structures. Magnified view of insets (at various seconds) is shown separately. Scale bars: 10 μm.
-
BPCR analysis of Rab22A‐depleted melanocytes. DNA band intensities were quantified and indicated on the gels.
-
CBF and IFM images of GFP‐Rab22AWT/Q64L/S19N‐transfected BLOC‐1‐deficient melanocytes. Black and white arrows indicate the melanocyte pigmentation and GFP‐Rab22A expression, respectively. Scale bars: 10 μm.
-
DSubcellular membrane fractionation of control and knockdown HeLa cells. The fractions were probed for HPS6 (red box).
-
E, FGraphs represent the percentage of membrane association of pallidin or HPS6 or Rab22A in the indicated cell types and derived from Fig 5B and C, respectively. n = 1.
-
GPull‐down of His‐Rab22AWT/Q64L using melanocyte lysate. The bead‐bound His‐Rab22A was shown as coomassie‐stained gel separately.
-
HTranscript levels of Rab22A and pallidin (BLOC‐1) in control and schizophrenia patients. Analysed from data set GSE53987 and then plotted (mean ± SEM). n = 15–18 samples. *P ≤ 0.05 and **P ≤ 0.01 (unpaired Student's t‐test).