
Fig. 1. Sex-Stratified Genome-Wide Association Results for CSF Aβ42.
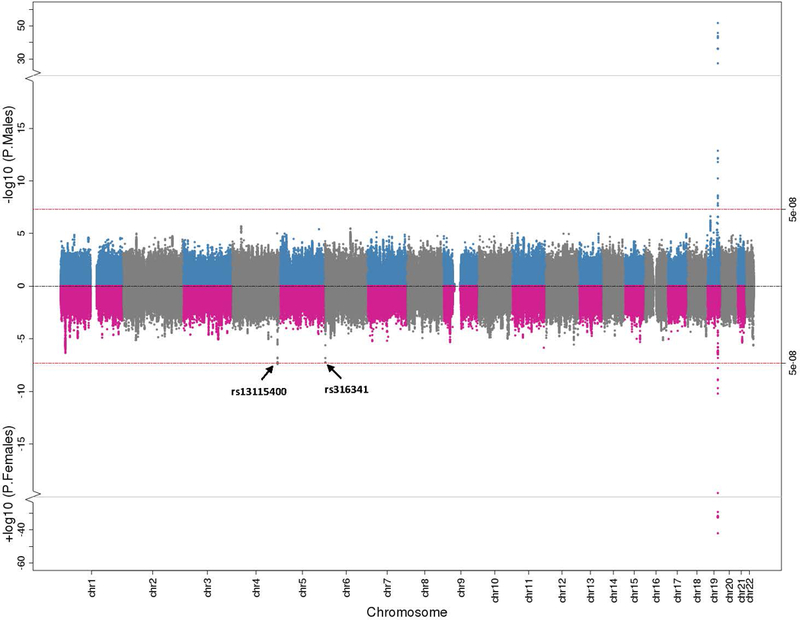
Miami plot illustrating CSF Aβ42 genome-wide association results stratified by males and females. Male findings are plotted in blue and grey on the top and female results are plotted in pink and grey at the bottom. The red lines at the top and bottom represent the genome-wide threshold for statistical significance (p<5×10⁻⁸).