
Extended Data Fig. 9. Functional Drug Sensitivity Landscape of the Beat AML Cohort.
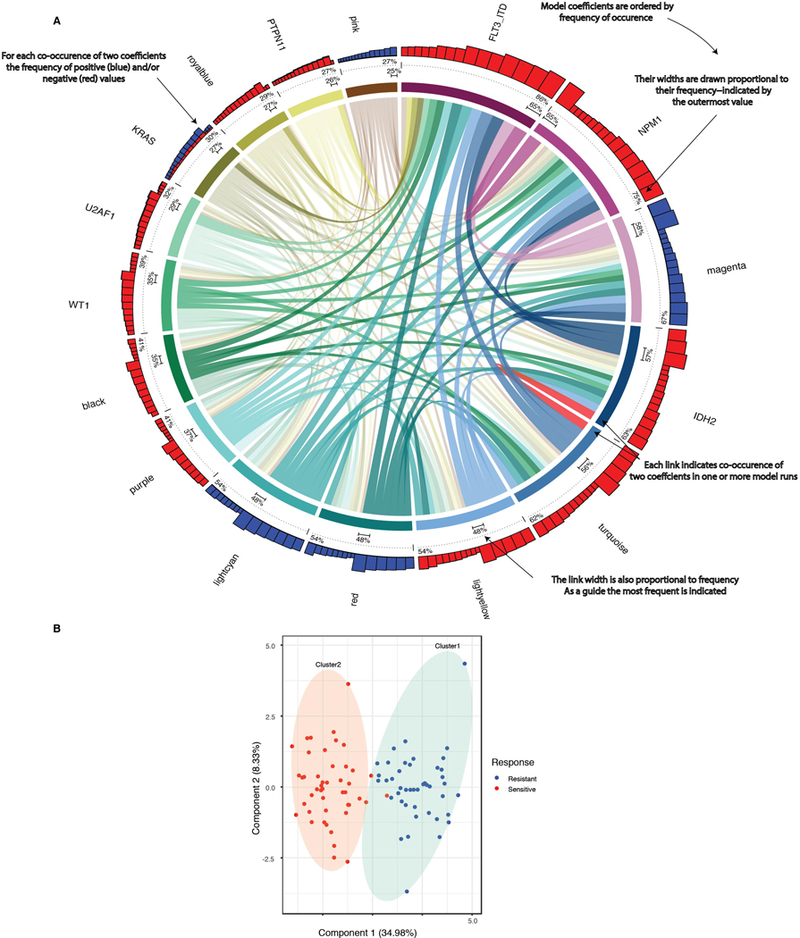
A. Co-occurrences with regard to WGCNA gene expression clusters and/or mutational events (coefficients) were detected by multivariate modeling with respect to ibrutinib response (resistance (blue); sensitivity (red)) with degree of correlation quantified in top track stacked barplot. All coefficients that appear in 25% of the bootstrap sample sets are shown as segments of the circle. Segment width (the colored ring) corresponds to the percentage of bootstrap samples in which that coefficient appears (quantified above the dotted line). The variables appear in descending order clockwise starting at 12 o’clock. Each link indicates pairwise co-occurrence of mutational events and gene expression clusters (width represents frequency of the co-occurrence). The largest co-occurrence for each coefficient is quantified.
B. The capacity of differential gene expression to distinguish the 20% most ibrutinib sensitive (n=46) from 20% most resistant (n=44) specimens is shown on a principle component plot (n=239 patient samples total tested for ibrutinib sensitivity and RNA-Sequencing).
For the n used to correlate each drug with gene expression and perform Lasso regression, please see Supplementary Information (Table S17).