
Extended Data Fig. 5. Pairwise Drug Sensitivity Correlations and Association with Drug Family.
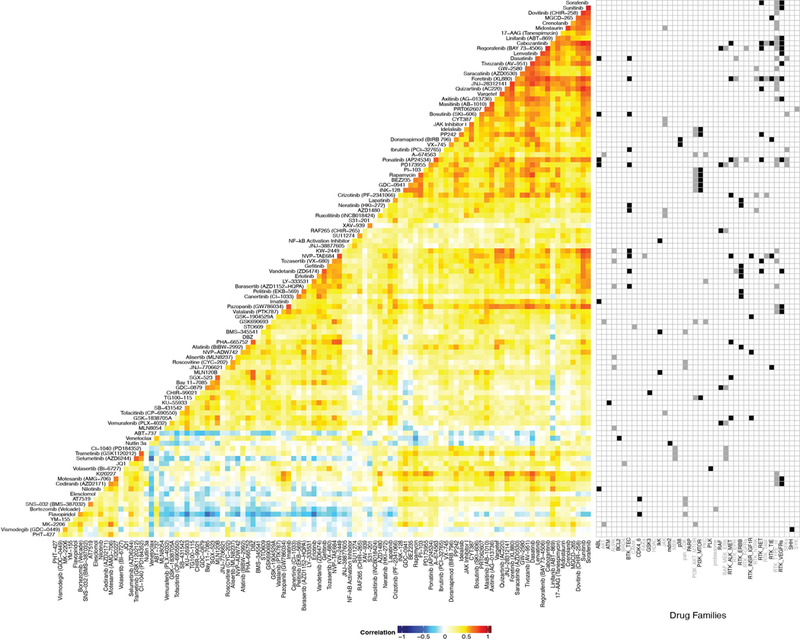
To understand patterns of small-molecule sensitivity against prior annotation of each drug’s gene and pathway targets, drugs were placed into drug families according to target genes and/or pathways and the Pearson’s correlation value of each drug was plotted onto a clustered heatmap showing drugs with similar or dissimilar patterns of sensitivity across the patient cohort. Prior knowledge annotation of the drug families to which each drug could be assigned is shown to the right of the heatmap with alternating black and grey boxes/labels used to aid in tracking. Descriptions of each drug family as well as the n used to calculate each pairwise drug correlation are found in Supplementary Information (Table S11,21).