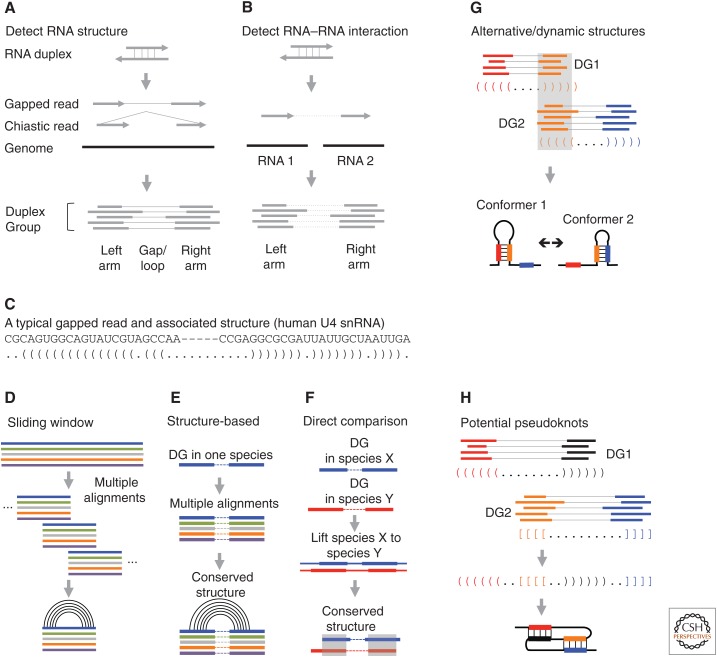
Figure 3.
RNA structure and interaction analysis based on cross-linking data. (A) Detecting RNA structures. Discontinuous sequencing reads, including “regularly” gapped and chiastic, are assembled into duplex groups (DGs). (B) Detecting RNA–RNA interaction. The two arms of discontinuous reads mapped to two RNA molecules are assembled into DGs. (C) An example of a discontinuous read from the U4 small nuclear RNA (snRNA). Pairs of parentheses indicate base pairs. (D) Conventional sliding window screen for conserved structures from whole genome alignments. Multiple genome alignments are split into windows with fixed width and step. Conservation and covariation are then scored in each window. (E,F) DGs guide comparative sequence analysis. (E) DGs from one species are used to extract two blocks of alignments separated by arbitrary distance for structure conservation analysis. (F) Structures can be directly compared with DGs from multiple species, using sequence alignments. (G) Alternative/dynamic RNA structures are identified based on the conflicts of the base-pairing models between two DGs. (H) Interlocked DGs suggest either alternative conformations or pseudoknot structures. (Panels E–G are adapted from Lu et al. 2016, with permission, from Elsevier.)

