
Fig. 1.
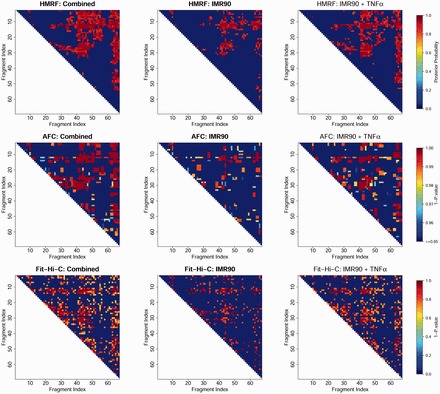
Peaks called in the domain Chr.17:29.52 Mb-29.72 Mb. For each dataset (combined, before and after TNF-α treatment), the same number of peaks as using AFC method was shown (based on posterior probabilities for HMRF and P-values for Fit-Hi-C) for comparison