
Fig. 2.
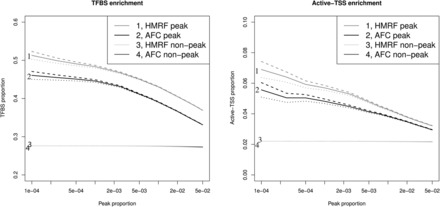
TFBS and active-TSS enrichment. Solid lines are estimated average levels. The 95% confidence interval of estimated average levels are represented by dashed lines and solid lines. Left panel: TFBS enrichment analysis. Right panel: active-TSS enrichment analysis