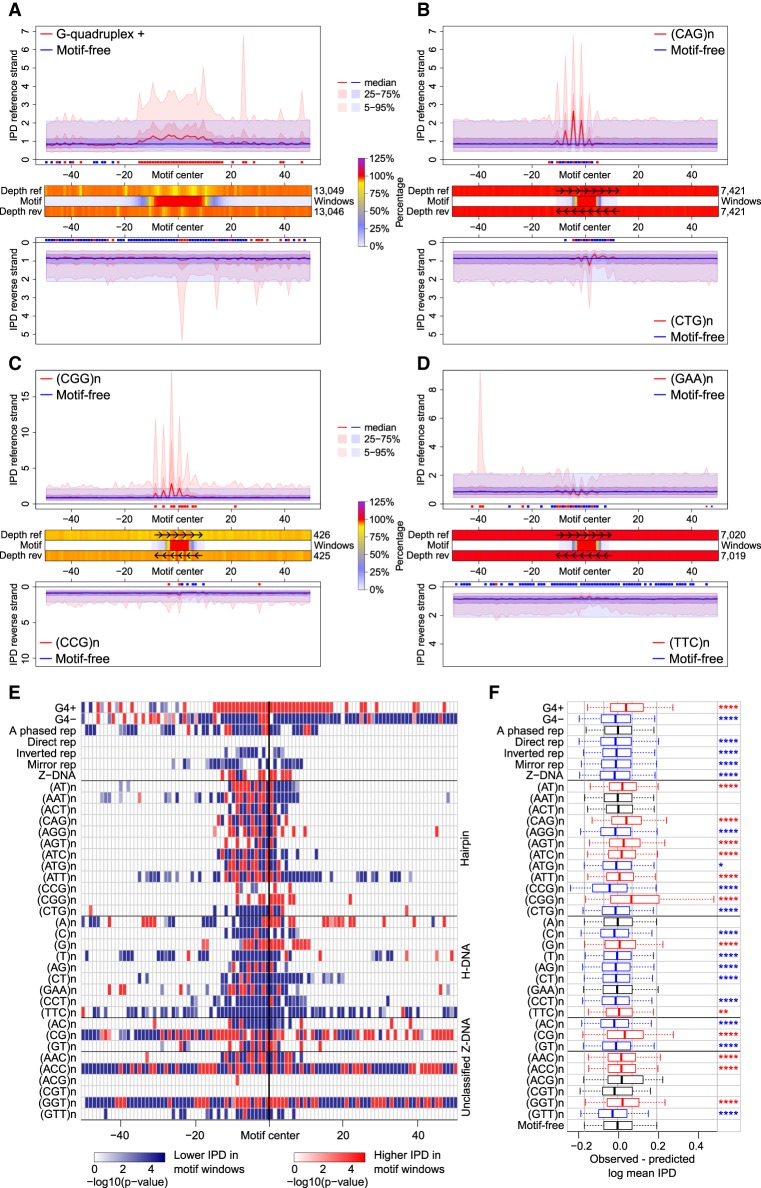
Figure 2.
Polymerization kinetics at non-B DNA. (A–D) IPD curve distributions in motif-containing (red) versus motif-free (blue) 100-bp windows, on reference (top) and reverse-complement (bottom) strands. Thick lines designate the medians; dark-shaded areas show the 25th–75th quantiles; light-shaded areas show the 5th–95th quantiles. Red/blue marks (below top and above bottom plots) show positions with IPDs in motif-containing windows higher/lower than in motif-free windows (IWT-corrected P-values ≤0.05). Heatmaps (between top and bottom plots) show sequencing depth of motif-containing relative to motif-free windows (in percentages, can be >100%) on reference (Depth ref) and reverse-complement (Depth rev) strands, and percentage of windows with the motif (Motif) at each position. (A) G-quadruplexes; (B–D) STRs with disease-linked repeat number variation; (E) IWT results for IPD curve distributions in motif-containing versus motif-free windows (reference strand). Each row shows significance levels (−log of corrected P-values) along 100 window positions for one motif type. (White) nonsignificant (corrected P-value >0.05); (red/blue) significant with IPDs in motif-containing windows higher/lower than in motif-free windows. STRs are grouped according to putative structure. (F) Comparison between observed mean IPDs in motif-containing windows and predictions from a dinucleotide compositional regression fitted on motif-free windows (reference strand). Bonferroni-corrected t-test P-values for differences: (****) P ≤ 0.0001; (***) P ≤ 0.001; (**) P ≤ 0.01; (*) P ≤ 0.05. (Black) nonsignificant (corrected P-value >0.05); (red/blue) significant with observed mean IPDs higher/lower than composition-based predictions; (box plot whiskers) 5th and 95th quantiles of the differences.

