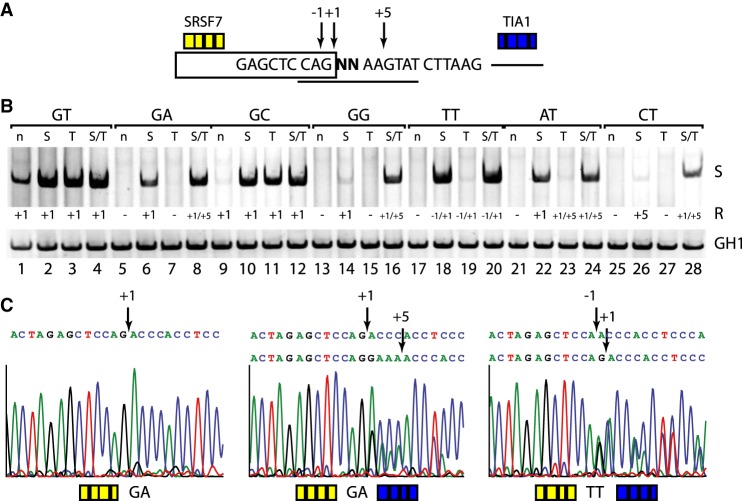
Figure 2.
Noncanonical 5′ss exhibit a greater enhancer dependency than canonical 5′ss. (A) Schematic of the HIV-1 minigene containing a single noncanonical splice site. Experimentally found splicing registers (−1, +1, +5) are indicated by arrows. Yellow and blue boxes represent upstream (SRSF7) or downstream (TIA1) enhancer repeats. (B) Activation of splice sites in presence or absence of splicing enhancers. RT-PCR analysis was carried out as described before. Used splicing registers (R) are given below the gel image. All experiments were performed in triplicate (Supplemental Fig. S6). (C) Splicing positions mapped by sequencing of the extracted RT-PCR products (for a complete overview, see Supplemental Fig. S1).

