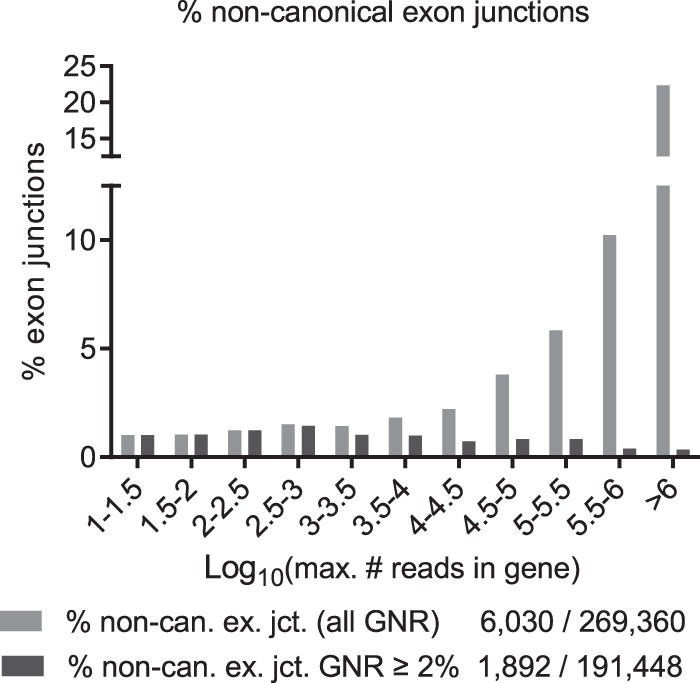
Figure 8.

Percentage of noncanonical exon junctions grouped by gene expression level (MRIG, log10 scale, separately normalized for each MRIG range) for all exon junctions (gray, 6030 noncanonical/269,360) and after exclusion of noise candidates (black, 1892 noncanonical/191,448 high-confidence). All exon junction reads were first grouped by MRIG range before normalization. After exclusion of noise, the level of noncanonical exon junctions was ∼0.4%–1% independent of gene expression level.
