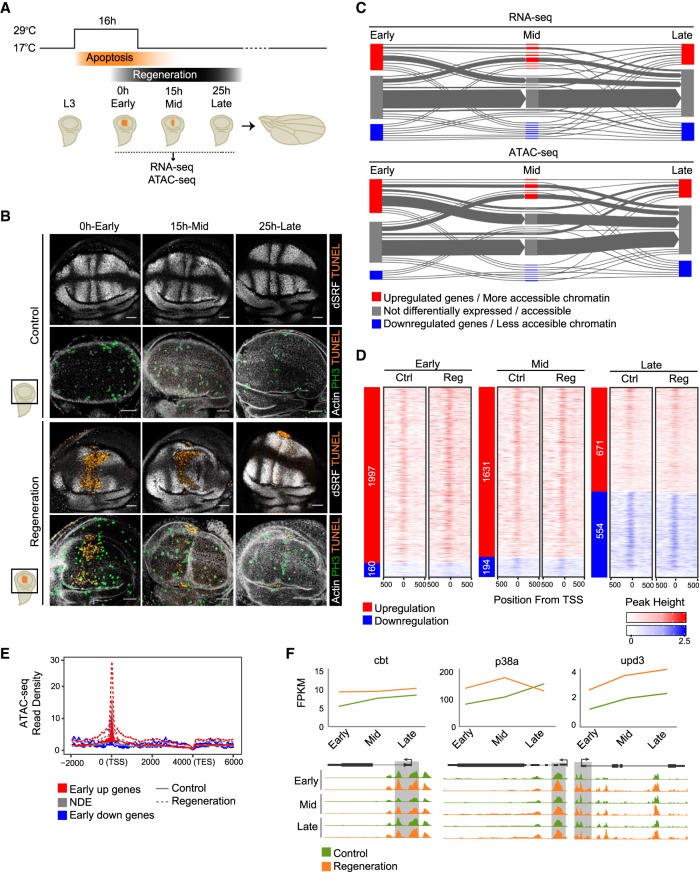
Figure 1.
Differentially expressed genes and accessible chromatin after induction of cell death. (A) Experimental design. Flies were raised at 17°C until the eighth day (192 h) after egg laying (equivalent to third instar larva or L3). Then they were moved to 29°C for 16 h to induce apoptosis triggered by rpr (reaper), specifically in the spalt major (salm) domain of the wing pouch (orange region), and then back to 17°C to switch off rpr and allow the tissue to regenerate. RNA-seq and ATAC-seq samples were collected immediately after switching off rpr (0 h: early), or at successive time points (15 h: mid; and 25 h: late). Controls without having undergone rpr expression were treated in parallel. (B) Confocal images of wing discs stained with Drosophila serum response factor (bs, also known as DSRF) antibody and actin to visualize the patterning, TUNEL assay to detect cell death, and H3P antibody to detect mitosis. (C) Flux plot showing RNA-seq dynamics (DE genes) and ATAC-seq dynamics (differential accessible regions) at the different time points. Each line represents a set of genes or accessible regions that behave in the same way over time. The line width denotes the number of genes or accessible regions. (D) Heatmaps showing ATAC-seq signal around ±500 bp from the transcription start site (TSS) of protein-coding DE genes at each time point. Sites are ordered by up-regulation and down-regulation (shown on the left) and by gene expression, based on regeneration samples. (E) Aggregation plot showing ATAC-seq read density at the early stage (control and regeneration) for each set of DE genes (up-regulated, nondifferentially expressed [NDE], and down-regulated). The TSSs of up-regulated genes show the highest number of ATAC-seq reads in regeneration. (F) Expression profile (FPKM) of cbt, p83a, and upd1 over time, in control and regeneration (top). Genome Browser screenshots depicting ATAC-seq peaks at the core promoter of cbt, p83a, and upd1, in control and regeneration over time (bottom).

