Figure 2.
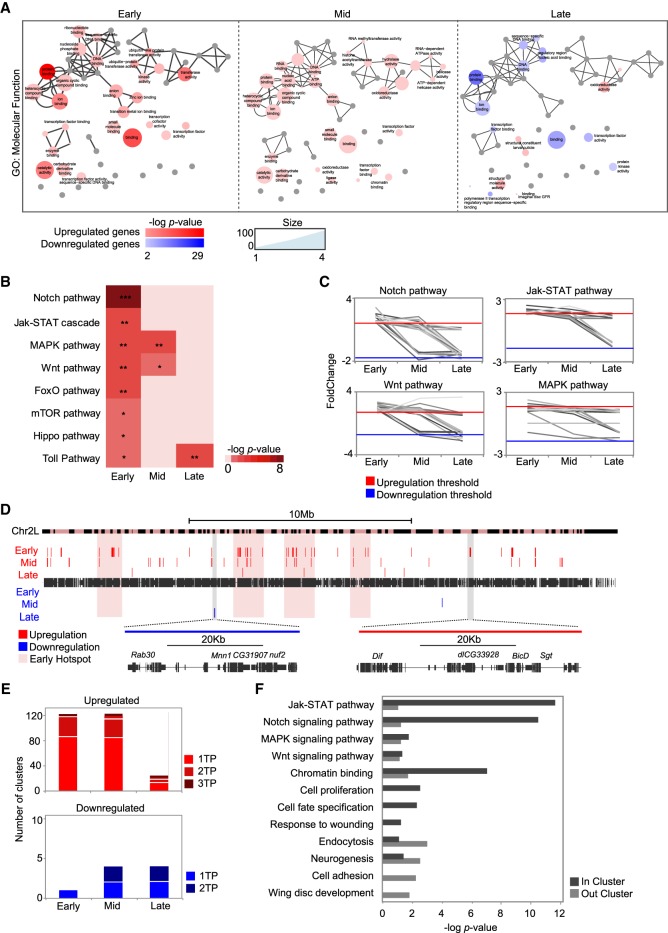
Genomic clustering of differentially expressed genes. (A) Gene Ontology term enrichment of differentially expressed genes at successive time points visualized by ReviGO. The size of the circles denotes the number of genes; circle color indicates the P-value of each term. Highly similar GO terms are linked by edges in the graph. (B) Heatmap of pathway enrichment in the set of up-regulated genes at each time point. The level of significance is denoted: (*) P < 0.05; (**) P < 10−2; (***) P < 10−3. (C) Line plots showing expression changes over time of genes that belong to signaling pathways significantly enriched in regeneration. Expression is shown as fold change between control and regeneration at each time point. Each gene is plotted as a single line. (D) Genomic map of clusters of differentially expressed genes on Chromosome 2L. Each red or blue box represents a single cluster; the size of each box denotes the length of the cluster. The magnified regions show one down-regulated cluster (blue, left) and one up-regulated cluster (red, right). Hotspots at the early stage are highlighted in pink. (E) Bar plot showing the number of clusters identified at only one time point, at two time points, and at all three time points. (F) Gene Ontology term enrichment for the set of up-regulated genes located inside or outside the clusters at early regeneration. All the categories plotted are significant in at least one group of genes (the absence of a bar denotes no enrichment in that group).

