Figure 3.
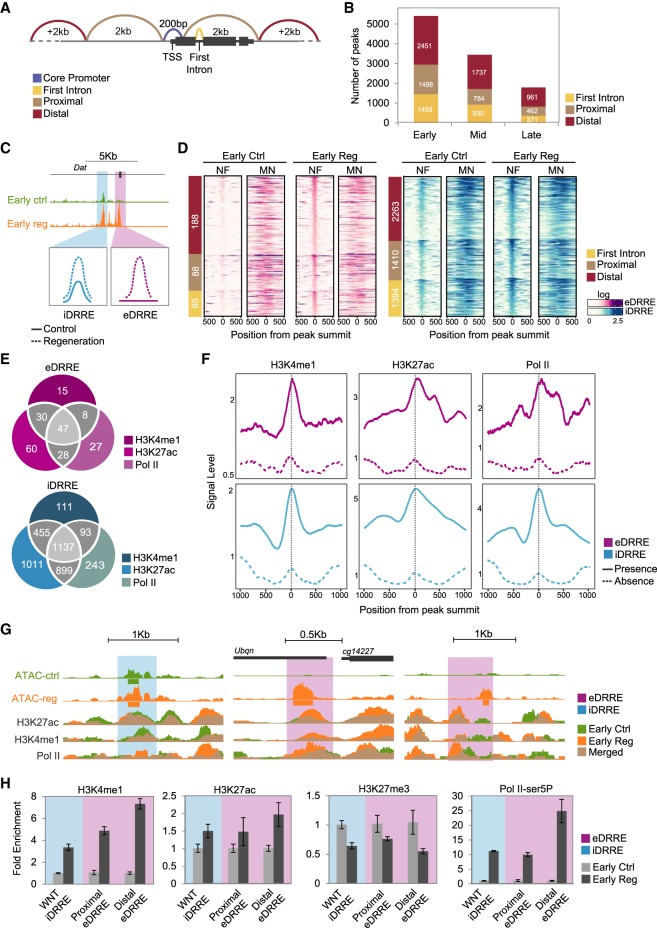
Accessible chromatin landscape after induction of cell death. (A) Schematic overview of peak distribution in the genome. (B) Bar plot showing the number of more accessible peaks at each time point falling in each genomic region: first intron, proximal, and distal. (C) Genome Browser screenshot and schematic drawing of iDRRE and eDRRE. (D) Heatmaps showing nucleosome-free (NF) and mononucleosome (MN) enrichment around ±500 bp from the peak summit of DRREs at the early stage of control and regeneration. Sites are ordered by genomic distribution (shown on the left), and by peak height based on ATAC-seq regeneration sample. (E) Venn diagrams showing the intersection of H3K4me1, H3K27ac, and Pol II at DRREs in regeneration. (F) Average profile of H3K4me1, H3K27ac, and Pol II at DRREs. A solid line denotes DRREs with the presence of at least one ChIP-seq signal; and a dashed line denotes the absence of any ChIP-seq signal. (G) Genome Browser screenshot showing ATAC-seq and ChIP-seq profiles (control and regeneration) of the DRREs tested by ChIP-qPCR. (H) ChIP-qPCR analysis of H3K4me1, H3K27ac, H3K27me3, and Pol II-ser5P on individual DRREs at the early stage. ChIP results are presented as fold change enrichment between control and regeneration. Error bars represent the standard error of the mean from two biological replicates.

