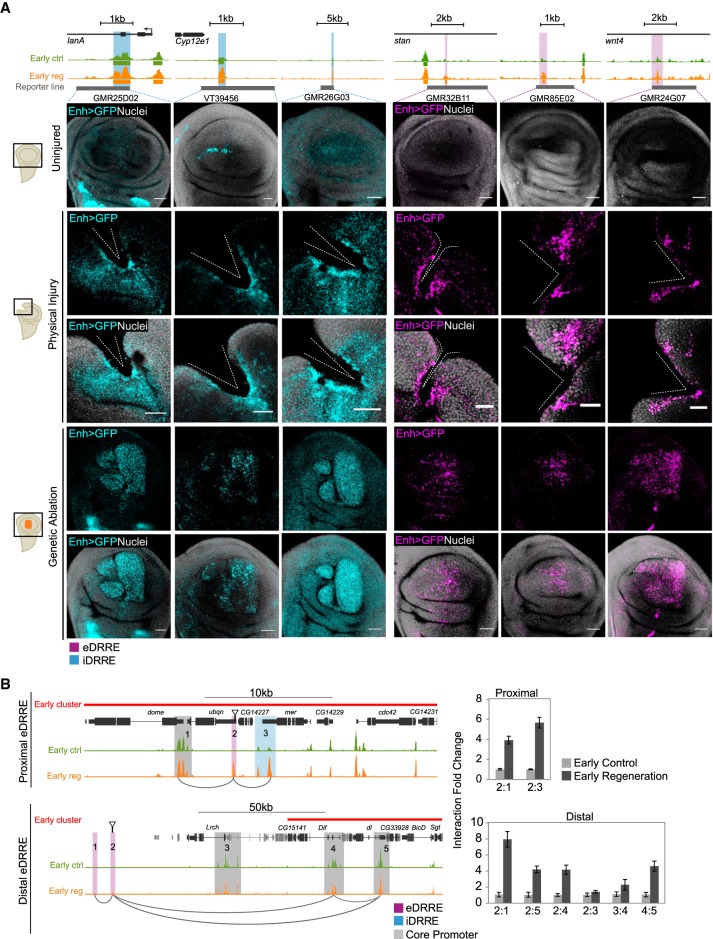
Figure 4.
Validation of the activity of DRREs after damage. (A) Validation of enhancer regions after induction of cell death or physical damage using reporter lines. Genome Browser screenshot showing the ATAC-seq profile (control and regeneration) at the early stage of regeneration of validated enhancers (highlighted in blue if iDRRE; purple if eDRRE), and the region covered by the reporter line in gray (top). Confocal images of wing discs showing enhancer activity as GFP intensity (blue if iDRRE; purple if eDRRE) and nuclei in gray (bottom). The injury domain is shown in a schematic drawing on the right. In cell death-induced discs, GFP labeling is located in the apical section, where living cells cover the apoptotic zone. (B) Genome Browser screenshots at the early stage highlighting regions used for 3C analysis (left). Arrows indicate the eDRRE peaks used as bait. qPCR-3C analysis showing interaction levels between eDRREs and both CP and iDRRE (right). 3C results are presented as the fold change of the interaction between control and regeneration. Error bars represent the standard error of the mean from two biological replicates. Positive interactions after damage are marked as connectors in the Genome Browser screenshot.

