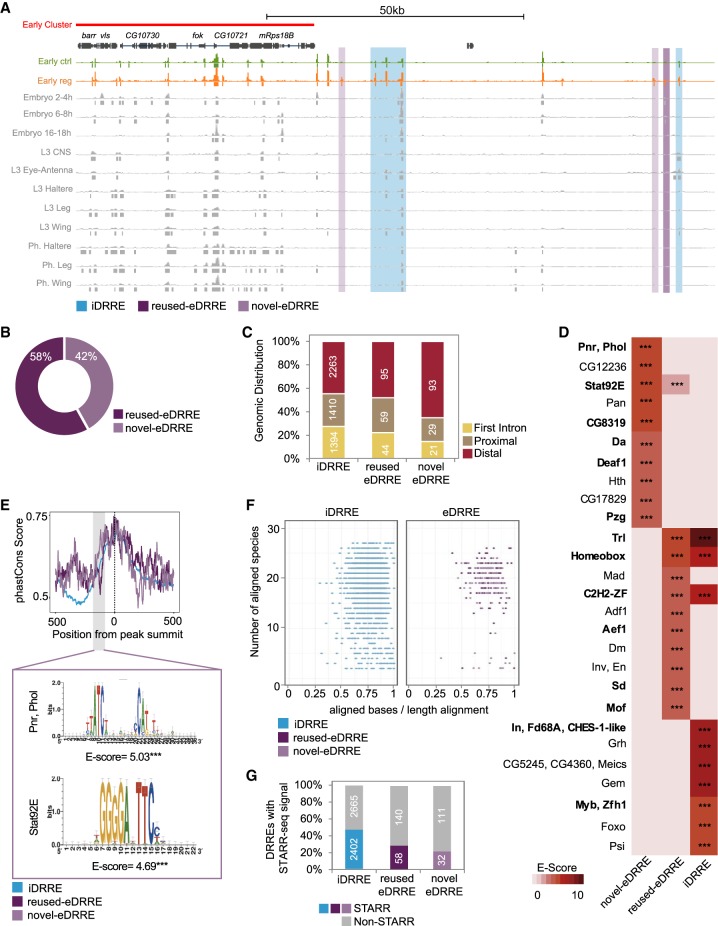
Figure 5.
Damage-responding regulatory elements used in other tissues and at other developmental stages. (A) Genome Browser screenshot depicting the alignment of iDRREs, reused eDRREs, and novel eDRREs with previously accessible regions identified by FAIRE at different developmental stages and in different tissues. (B) Classification of eDRRE usage. FAIRE data for embryo (2–4 h; 6–8 h; 16–18 h), L3 (central nervous system, eye antenna, haltere, leg), and pharate (haltere, leg, wing) are used. eDRREs falling in at least one of the data sets are considered as reused eDRREs. (C) Genomic distribution of DRREs: first intron, proximal, and distal. (D) Heatmap showing top 10 enriched TF motifs in each DRRE type. Up-regulated TFs are marked in bold. The level of significance is denoted: (***) P < 10−3. (E) Average distribution of PhastCons scores derived from 27 insect species in the DRRE sequences (defined as 500 bp upstream of and downstream from the NF peak summit). The highlighted section represents a more conserved region at −100 bp from the peak summit in novel eDRREs with its motif enrichment. The level of significance is denoted: (***) P < 10−3. (F) Conservation of DRREs across 27 insect species. Each dot corresponds to one independent enhancer. The y-axis denotes the number of species that present the conserved enhancer. The x-axis represents the percentage of aligned bases per sequence length. (G) Percentage of conserved DRREs that are active, according to the STARR-seq technique.

