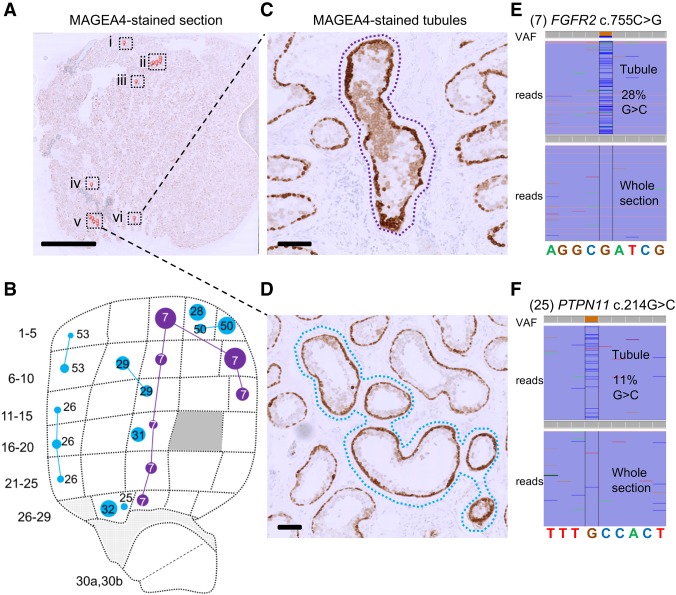
Figure 3.
Visualization of mutant tubules in Testis 2. (A) A 5-µm-thick section from Tes2E, a FFPE block of tissue adjacent to the testis slice 2F (B), immunostained with anti-MAGEA4 antibody to label spermatogonia. Seminiferous tubules with enhanced MAGEA4 immunopositivity, suggestive of the presence of mutant clones are labeled with small red pins and boxed. Scale bar, 5 mm. (C,D) High-magnification view of cross-sections with MAGEA4-enhanced immunopositivity in two localized areas are labeled with dotted lassoes representing the laser-microdissected regions. Scale bars, 100 µm. (E,F) Results from targeted resequencing of the microdissected seminiferous tubules labeled by dotted lassoes in C and D, respectively, viewed in integrated genome viewer (IGV), with local genomic sequence context indicated at the bottom. VAF of mutant reads is indicated on the top using color specific for each base pair; spontaneous pathogenic FGFR2 c.755C > G (no. 7; E) and PTPN11 c.214G > C (no. 25; F) variants were identified in DNA extracted from microdissected tubule cross-sections, but not in DNA from the whole-tissue section. Comparison of the MAGEA4 section (A) with adjacent testis slice 2F from the RainDance screen (B; the same image as in Figure 1B but showing only the targeted FGFR2 and PTPN11 mutations) shows that both variants match to a mutation previously identified in the corresponding position of testis slice 2F.

