Figure 1.
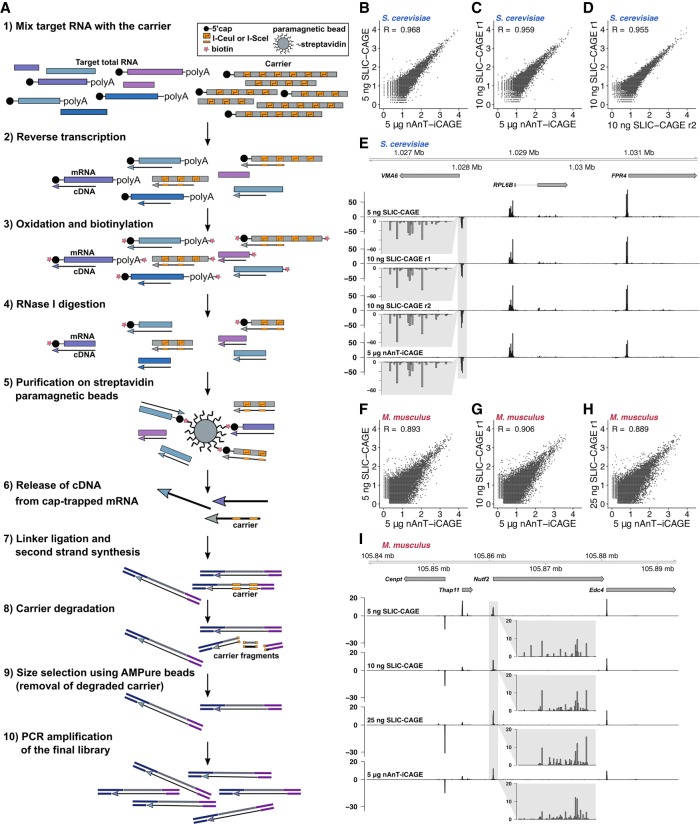
SLIC-CAGE development and assessment. (A) Schematics of the SLIC-CAGE approach. Target RNA of limited quantity is mixed with the carrier mix to get 5 µg of total RNA material. cDNA is synthesized through reverse transcription and cap is oxidized using sodium periodate. Oxidation allows attachment of biotin using biotin hydrazide. In addition to the cap structure, biotin gets attached to the mRNA's 3′ end, as it is also oxidized using sodium periodate. To remove biotin from mRNA:cDNA hybrids with incompletely synthesized cDNA, and from mRNA's 3′ ends, the samples are treated with RNase I. Complete cDNAs (cDNA that reached the 5′ end of mRNA) are selected by affinity purification on streptavidin magnetic beads (cap-trapping). cDNA is released from cap-trapped cDNA:mRNA hybrids and 5′- and 3′-linkers are ligated. The library molecules that originate from the carrier are degraded using I-Sce-I and I-Ceu-I homing endonucleases and the fragments removed using AMPure beads. The leftover library molecules are then PCR-amplified to increase the amount of material for sequencing. (B,C) Pearson's correlation at the CTSS level of nAnT-iCAGE and SLIC-CAGE libraries prepared from (B) 5 ng or (C) 10 ng of S. cerevisiae total RNA. (D) Pearson's correlation at the CTSS level of SLIC-CAGE technical replicates prepared from 10 ng of S. cerevisiae total RNA. The axes in B–D show log10(TPM+1) values and the correlation was calculated on raw, non-log-transformed data. (E) CTSS signal in example locus on Chromosome 12 in SLIC-CAGE libraries prepared from 5 or 10 ng of S. cerevisiae total RNA and in nAnT-iCAGE library prepared from standard 5 µg of total RNA. The inset gray boxes show a magnification of a tag cluster. (F–H) Pearson's correlation at the CTSS level of nAnT-iCAGE and SLIC-CAGE libraries prepared from (F) 5 ng, (G) 10 ng, or (H) 25 ng of M. musculus total RNA. The axes in F–H show log10(TPM+1) values and the correlation was calculated on raw non-log-transformed data. (I) CTSS signal in example locus on Chromosome 8 in SLIC-CAGE libraries prepared from 5, 10, or 25 ng of M. musculus total RNA and in the reference nAnT-iCAGE library prepared from standard 5 µg of total RNA. The inset gray boxes show a magnification of a tag cluster, and one bar represents a single CTSS.

